
How to Find, Research, and Analyze ETFs with Stock Rover
Exchange-Traded Funds (ETFs) have given investors an easy way to build diversified portfolios at a low cost. But most brokerage platforms are designed for executing trades, not for researching ETFs or understanding how they work together.
To build a resilient portfolio, you need to know more than an ETF’s name, price, and expense ratio. You need to be able to find quality funds, compare them across meaningful metrics, understand their underlying holdings, and monitor how they affect your portfolio.
Stock Rover brings those capabilities together in one workflow. Here’s how to use it across the ETF investing lifecycle.
Finding and Filtering ETFs (The Screener)
With thousands of ETFs trading on the market, finding the right building blocks can feel like searching for a needle in a haystack. You do not want to rely on marketing brochures; you want to rely on hard data.
The best place to start is the Stock Rover Investor’s Library, which contains dozens of out-of-the-box, importable screeners designed by experts.
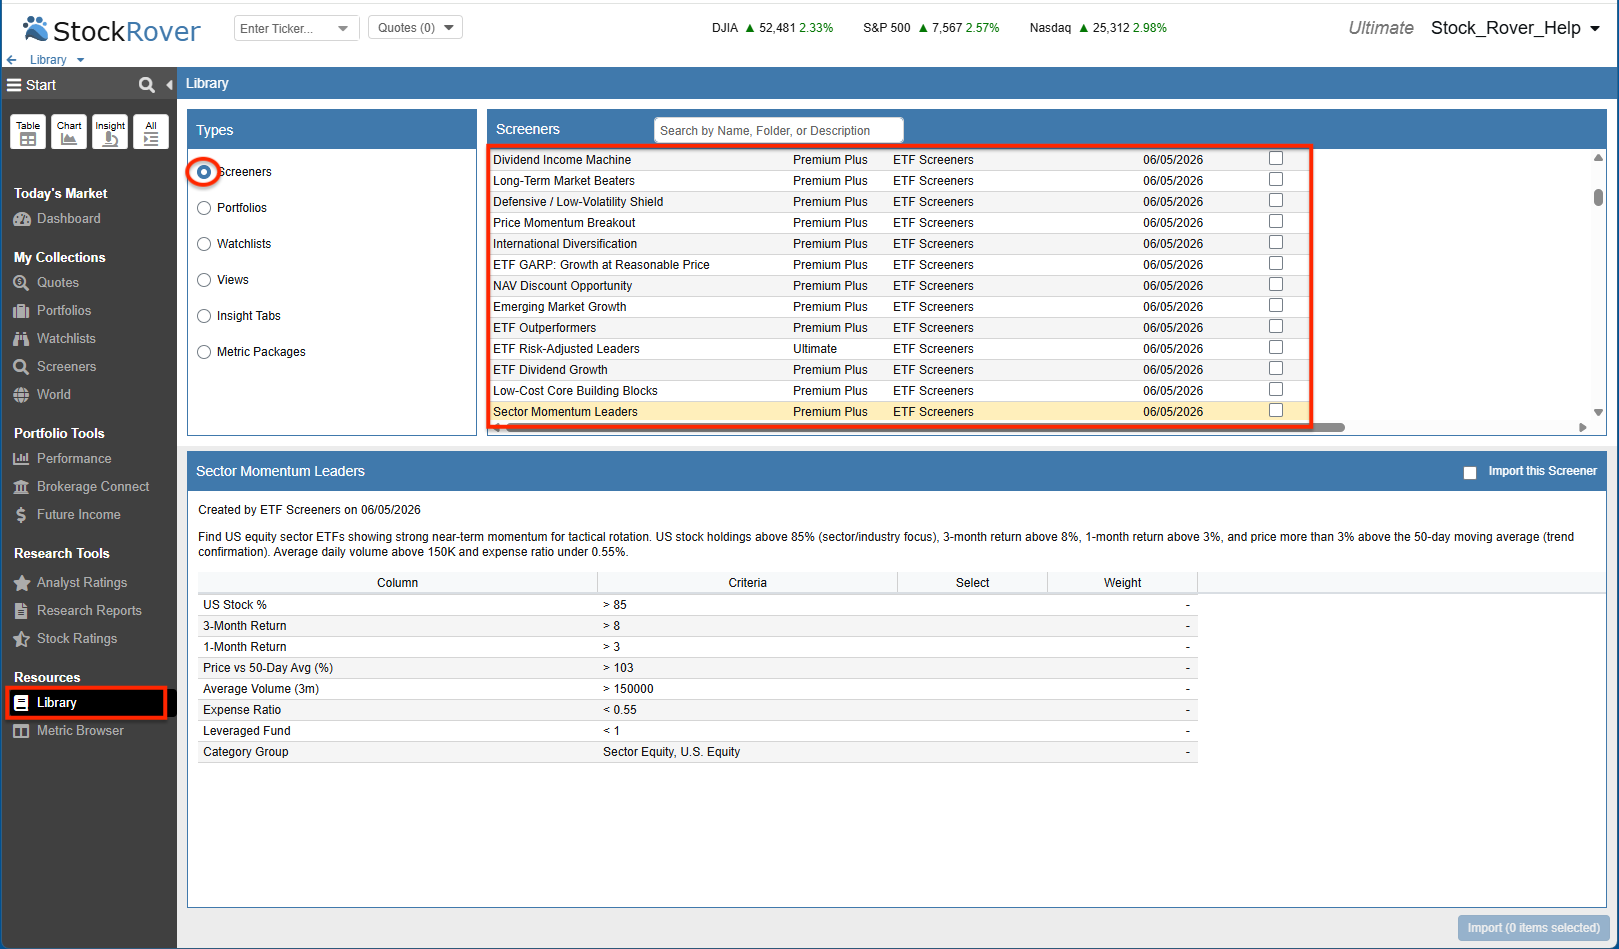
Pre-built ETF screeners are ready to import from the Investor’s Library.
Whether you are looking to build a passive foundation or make tactical bets, Stock Rover provides screeners for every strategy:
- Defensive / Low-Volatility Shield: Find ETFs engineered to reduce portfolio volatility and limit drawdowns by filtering for independent risk gates like a 3-year Beta below 0.80 and a Max Drawdown no worse than -20%.
- Dividend Income Machine: Filter out dangerous yield traps and find funds that balance current income with strong underlying profitability.
- Dividend Growth & Consistency: Locate reliable funds that have a proven track record of maintaining and growing their payouts.
- Contrarian Insider Value & Daily Winners: Target active satellite strategies by isolating out-of-favor value plays or funds breaking out with strong daily momentum.
You can instantly eliminate bloated or illiquid funds by setting strict limits on Expense Ratio, Net Assets (AUM), and Average Daily Volume. You can also enforce quality floors using Morningstar Ratings, or analyze income funds by comparing Trailing Twelve Month (TTM) Yield directly against Forward Dividend Yield.
Deep Dive Research and Comparison
Once your screeners have identified a shortlist of promising candidates, it is time to put them under the microscope. The Table feature is your central hub for comparative analysis. By loading your candidates into the “ETF & Fund Profile” view, you can evaluate multiple ETFs side-by-side. The Views dropdown also provides access to numerous other predefined views, each featuring a different combination of metrics, allowing you to instantly switch your table to analyze historical performance, dividend health, technical momentum, or whatever best suits your requirements.
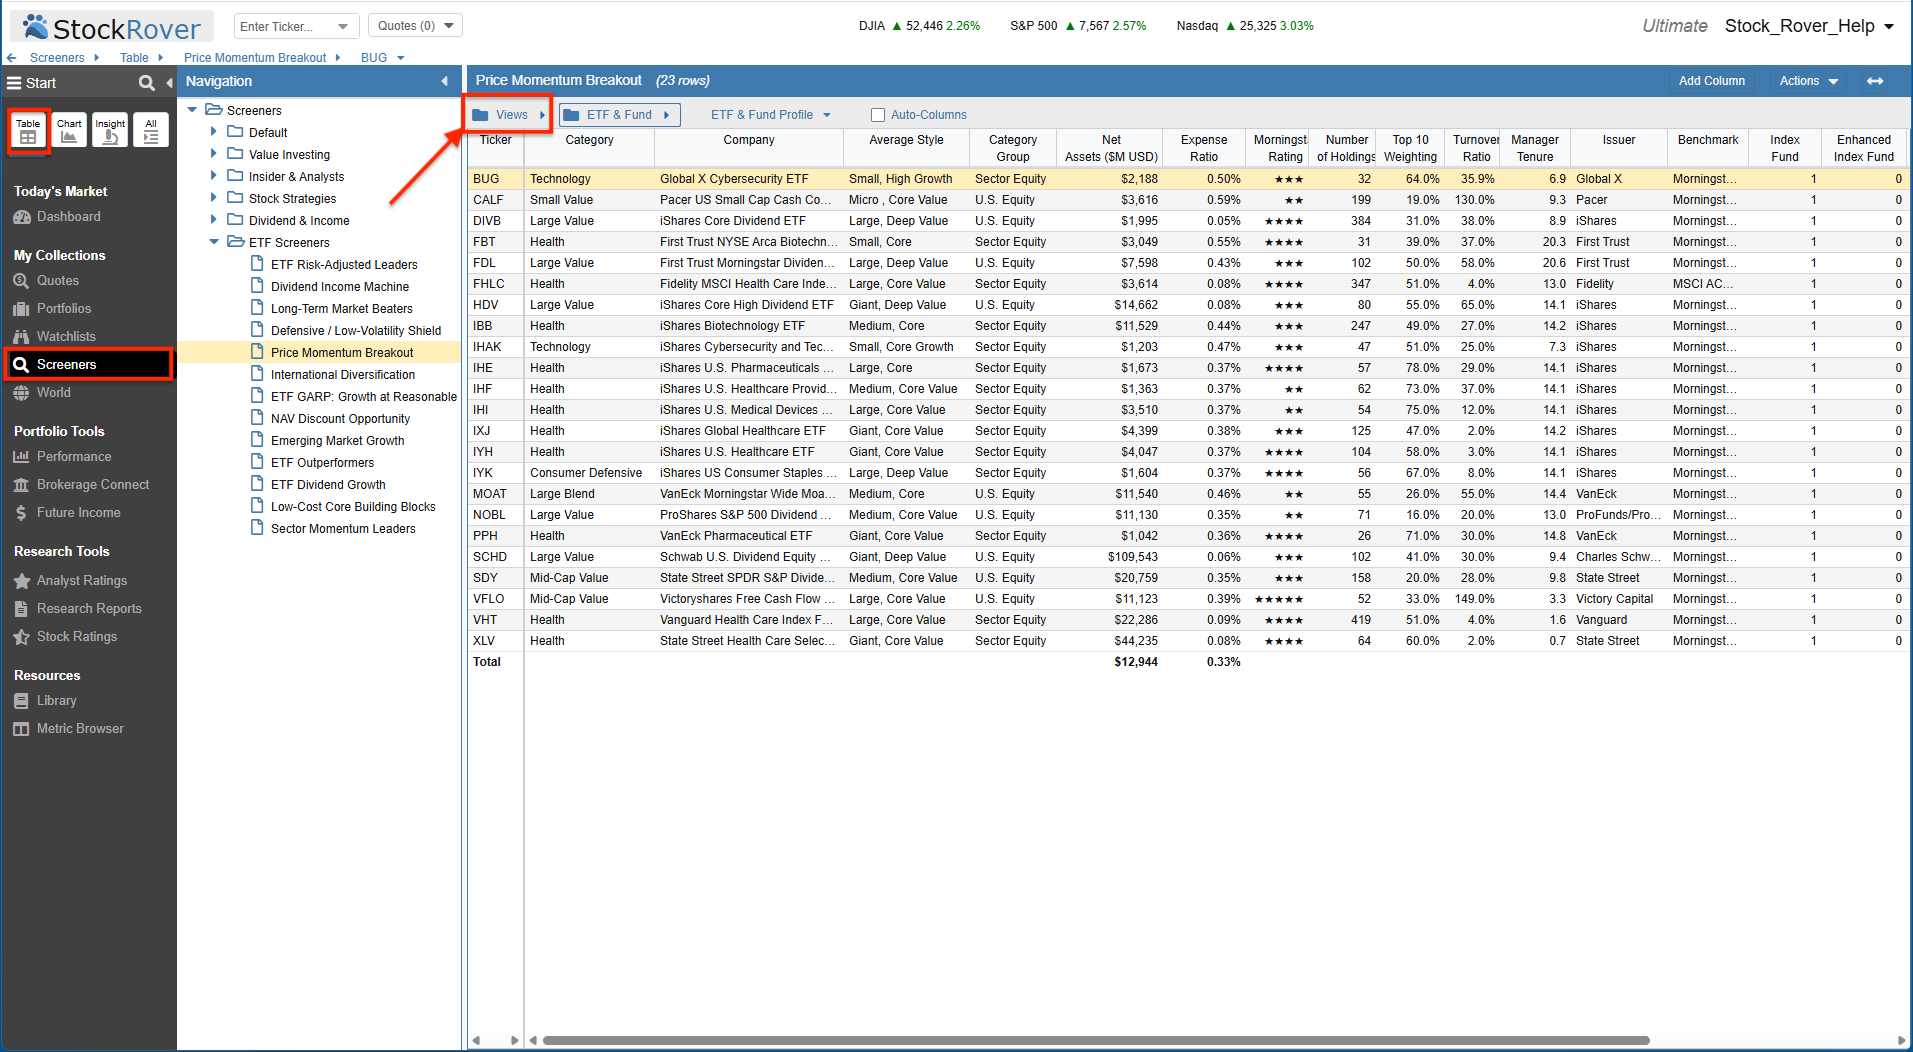
Compare ETFs side-by-side across multiple views and metrics.
To visualize historical performance, Stock Rover’s powerful Charting capabilities allow you to compare your ETF candidates directly against any dataset you choose. Whether you want to test an ETF against a major benchmark like the S&P 500, another specialized index, or a competing set of peer ETFs, the charting tool shows you exactly how they behave during varying market conditions.
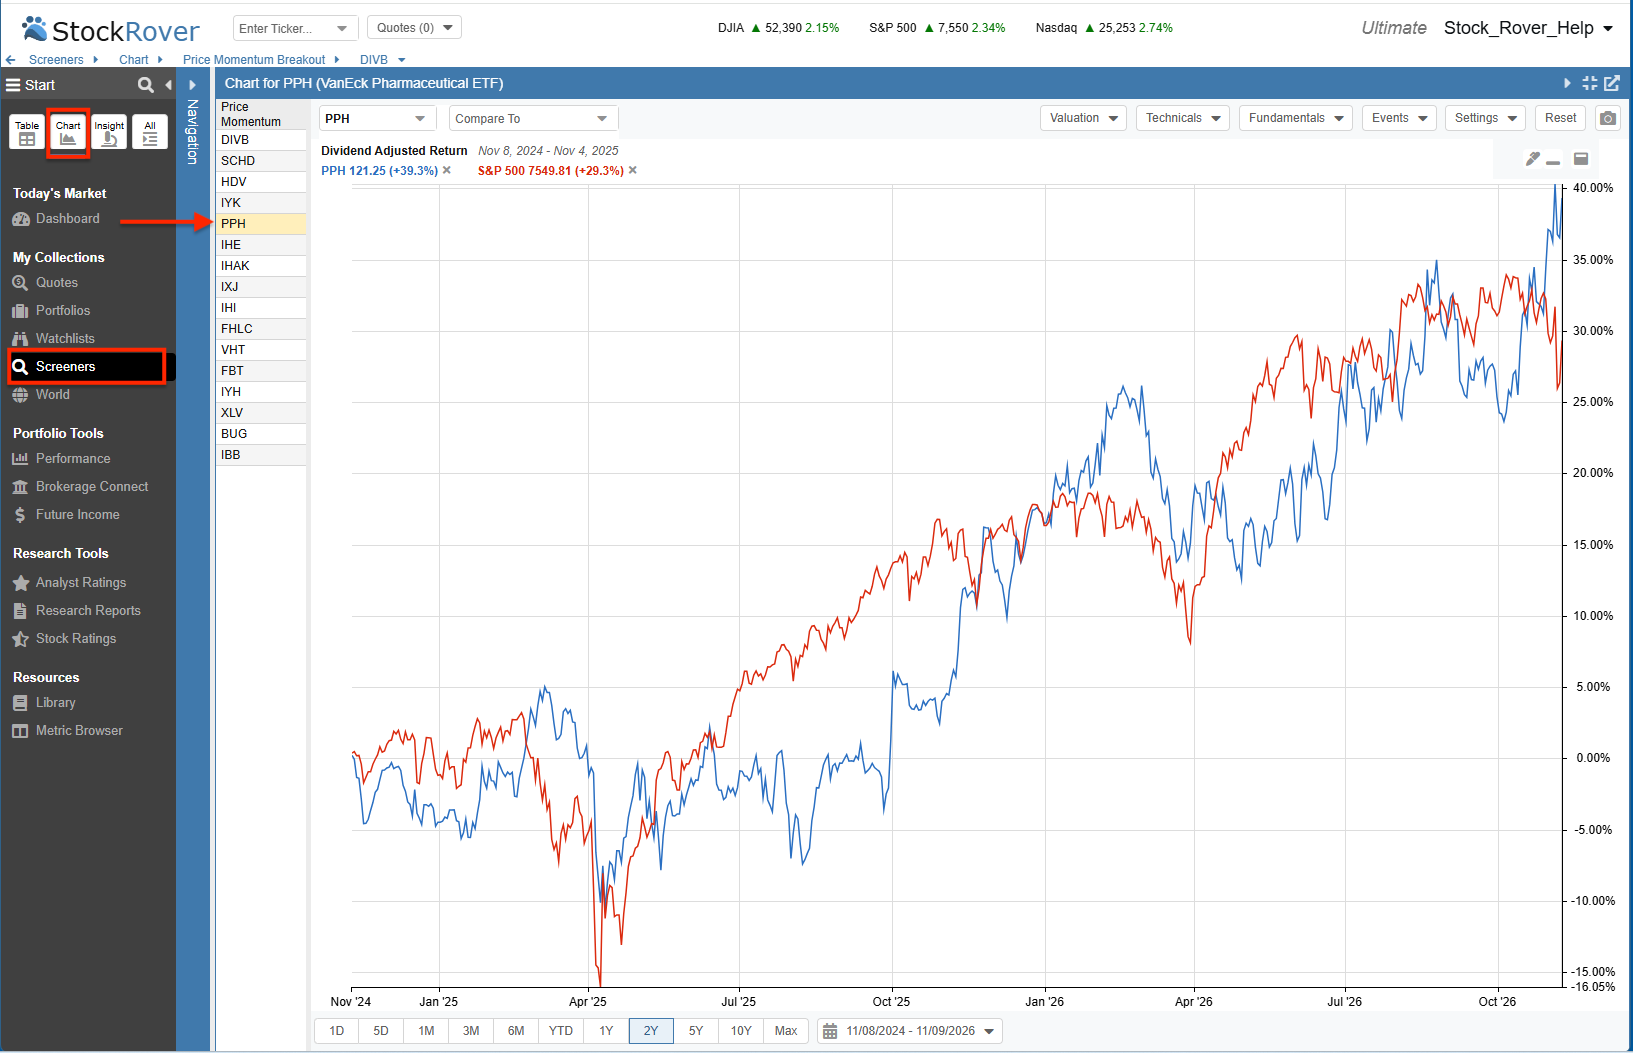
Compare dividend-adjusted returns against any benchmark.
When you want to zoom in on a single fund, the Insight Panel (Summary Display) provides a fast, digestible overview. In one clean display, you can view the ETF’s profile, historical price performance, and a detailed fund description. The panel offers deep visibility into Risk, Trailing Returns, Returns vs Benchmarks, and other key fund characteristics.
You can also review automated Investor Warnings, Costs & Efficiency metrics, Dividend payout details, aggregate Holding Statistics, Technicals, Top Stock Holdings, and Asset Allocation by asset type and World Regions.
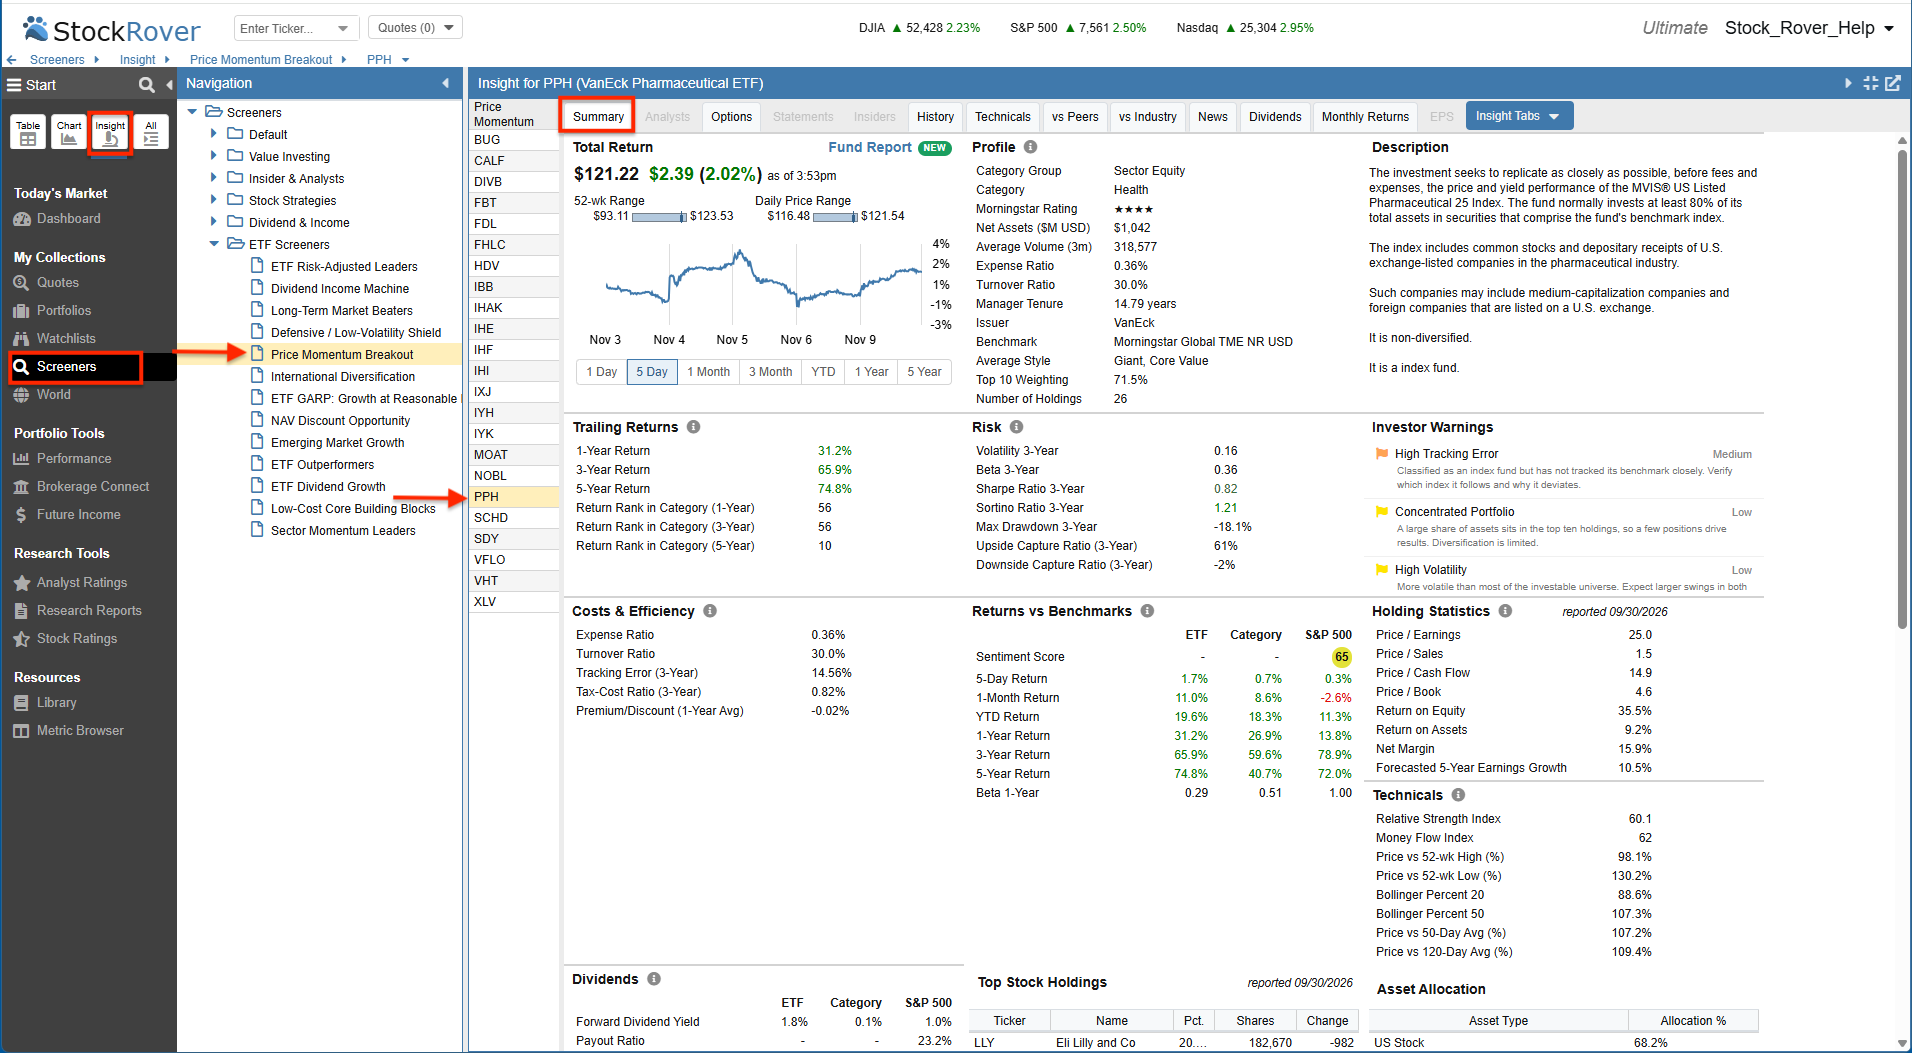
The Insight Panel provides a fast, comprehensive view of a single ETF.
The Ultimate Due Diligence: Stock Rover Fund Reports
While the Table and Insight Panel are fantastic for quick screening, the ultimate due diligence check requires Stock Rover’s powerful and unique Fund Reports. You can instantly access this comprehensive report by right-clicking on any ticker and selecting “Fund Report,” or by clicking the direct link inside the Insight Panel’s Summary tab.
Consider the VanEck Pharmaceutical ETF (PPH). Its Fund Report (click here to view the full PDF example) gives you a complete tear sheet containing its 4-star Morningstar Rating, proprietary Risk and Income Scores, and a detailed Business Summary. You can instantly review its Top Holdings, see concentration in companies such as Eli Lilly and Merck, and verify that its 100% Healthcare sector weighting fits your asset allocation targets.
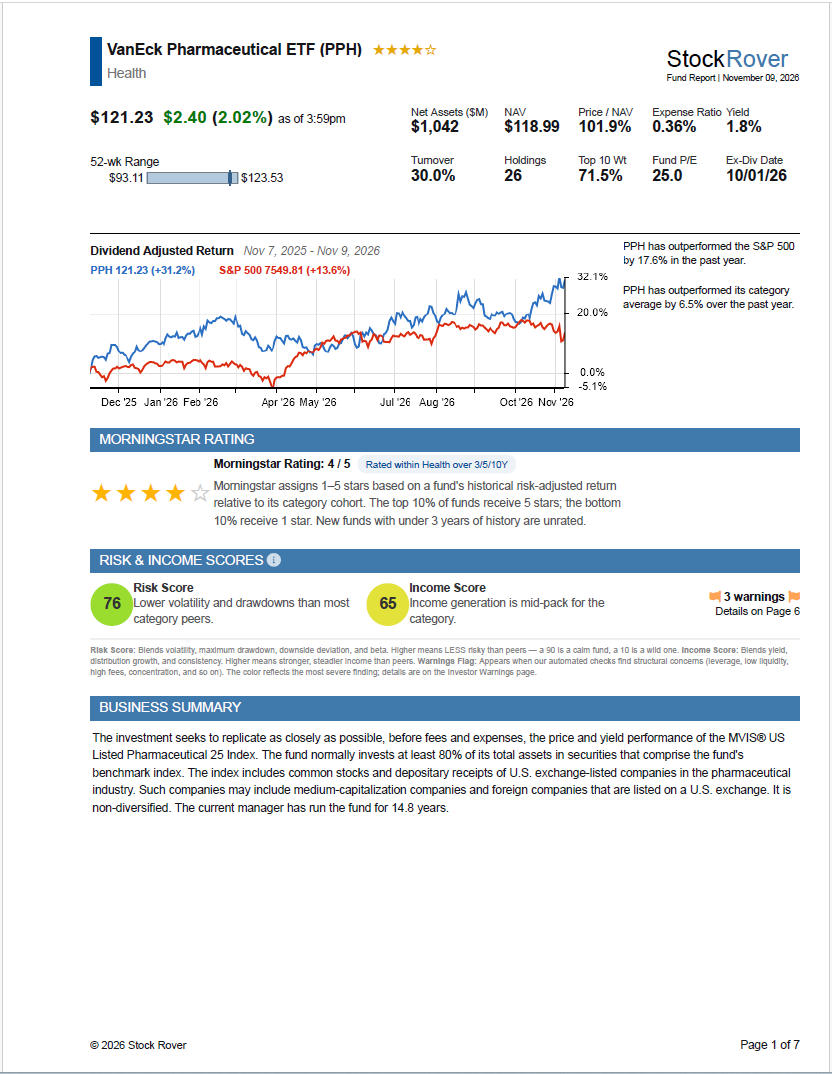
Fund Reports bring detailed ETF research together in one comprehensive view.
But the report goes far beyond basic holdings. It exposes the fund’s true behavior with deep dives into Historical Trends, Seasonality, and a comprehensive Risk Summary. You can evaluate the fund’s Costs and Efficiency, track past Distributions, and review automated Investor Warnings, such as alerts for concentrated portfolios and loose index tracking. Finally, the Peers Analysis section allows you to benchmark the ETF against its closest competitors.
Portfolio Analytics and Ongoing Tracking
Buying great ETFs is only the first step. The true test of a successful investor is how well they manage those combined assets over time. Stock Rover’s portfolio analytics elevate your wealth management from simple account balances to professional-grade oversight.
A standout feature of this analytical suite is the Portfolio Performance Tool. This comprehensive section features several dedicated tabs to analyze your investments. The primary Report tab provides details of your portfolio’s true performance, calculating your overall Internal Rate of Return (IRR), actual income received, and dividend-adjusted returns compared to a benchmark over any given timeframe.
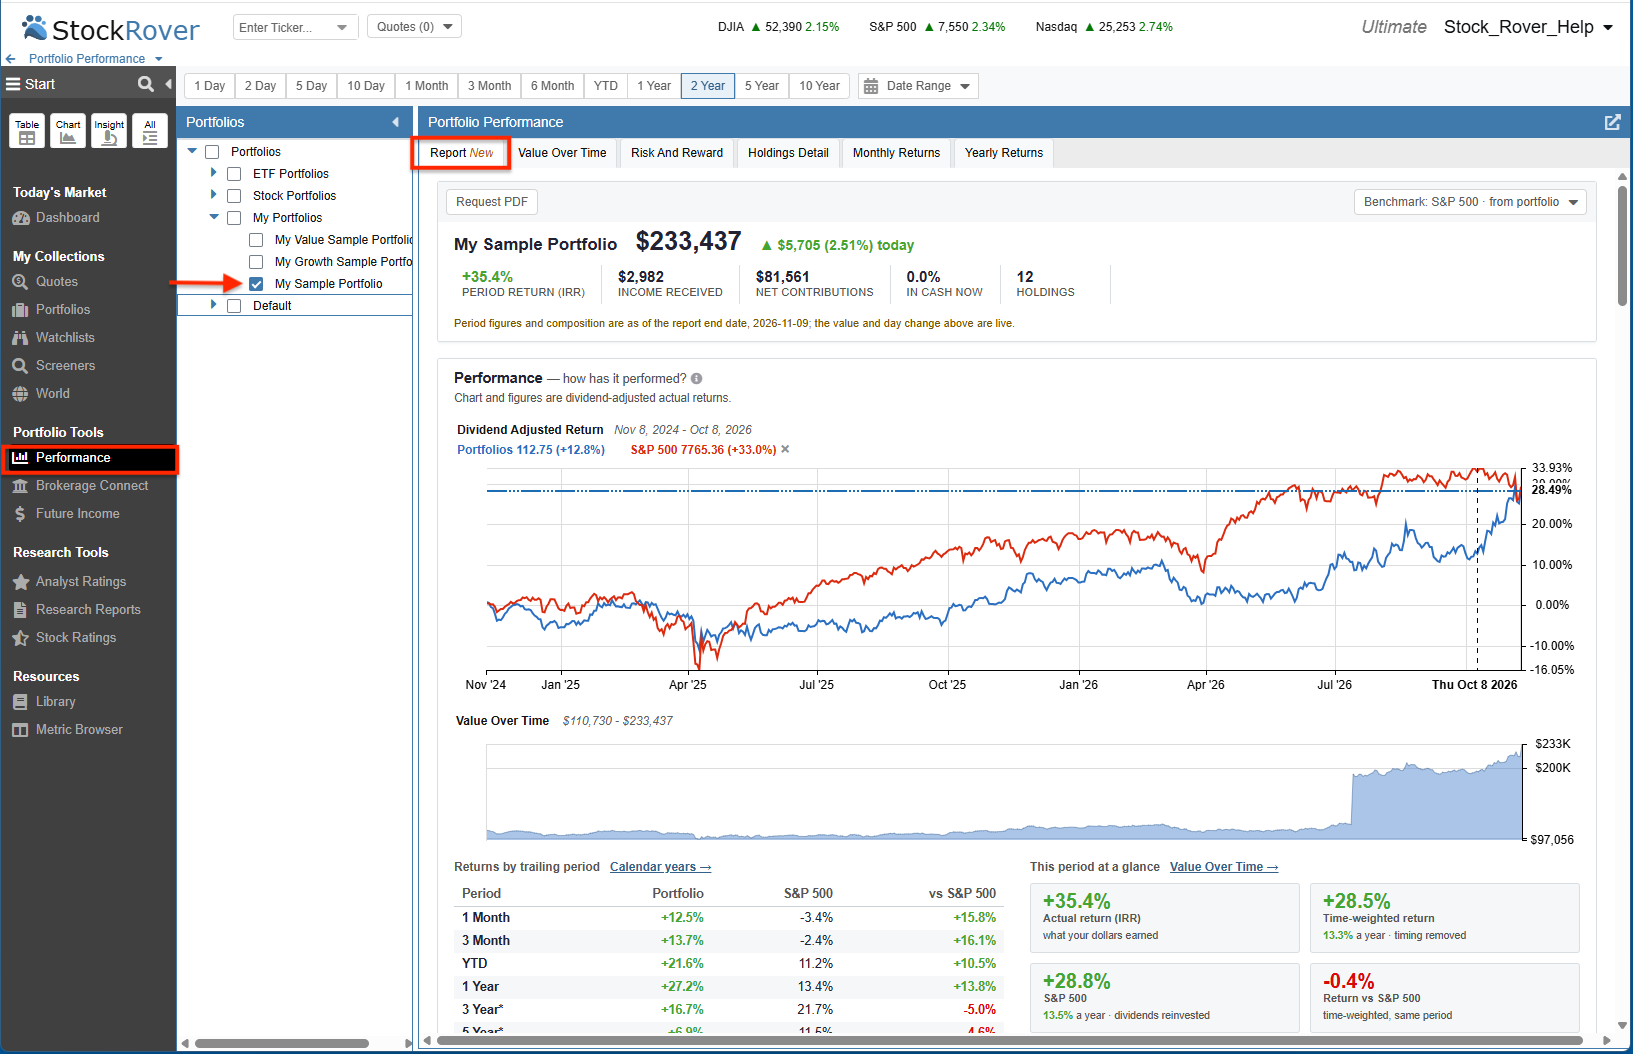
The Performance Report calculates your true IRR while accounting for cash inflows and outflows.
Scrolling down within the Report tab, you will find the True Exposure capability. When you own multiple ETFs, you inevitably own overlapping stocks. True Exposure aggregates the underlying holdings of all your ETFs to reveal your exact exposure to individual equities, showing exactly what percentage of Eli Lilly, Johnson & Johnson, and Walmart you own across your entire portfolio. It also maps your portfolio’s aggregate Style Box, World Regions, and Sector Weights.
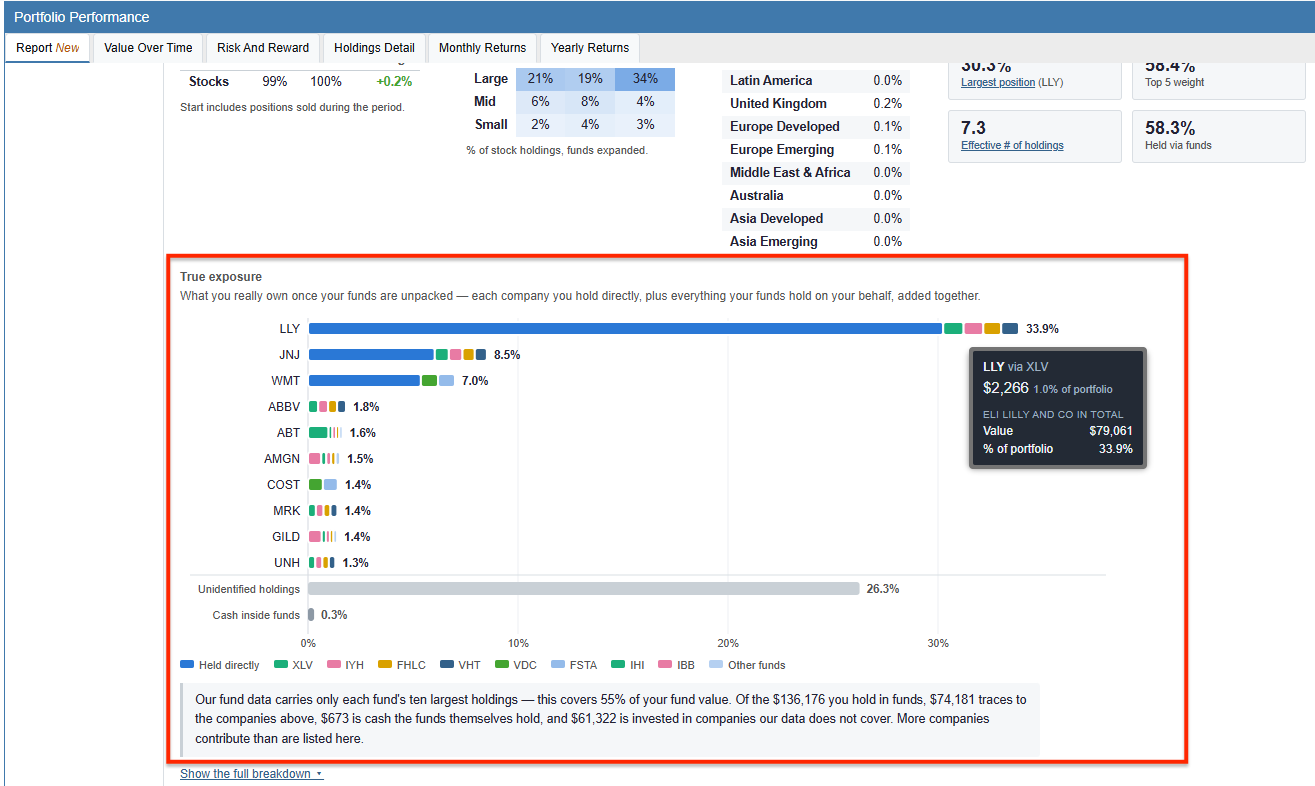
True Exposure reveals your actual underlying stock weightings across ETFs.
Finally, the Report tab shines a light on hidden costs with its What you pay analysis. It calculates your portfolio’s weighted expense ratio and translates those percentages into actual dollar amounts, showing exactly what you are paying in fees this year and over the next decade.
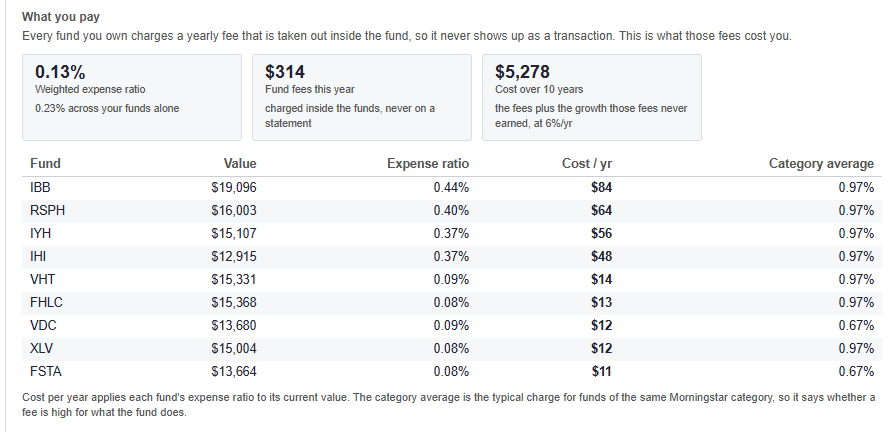
See the actual dollar cost of your portfolio’s ETF expense ratios.
Standalone Portfolio Tools
Beyond the Performance section, Stock Rover provides several powerful standalone tools for ongoing portfolio management:
- Correlation Matrix: Tests how closely your different ETFs move together. By identifying highly correlated funds, you can avoid the “Sector Illusion” and ensure true diversification. Combining low-correlating ETFs in a portfolio reduces overall volatility, limits maximum drawdowns, and improves risk-adjusted performance.
- Future Income Tool: For dividend investors, this tool is indispensable, aggregating specific yields of all your ETFs to project upcoming monthly cash flow.
- Rebalancing Tool: Automates the math, calculating the exact number of shares you need to buy or sell to restore your portfolio to its target allocation.
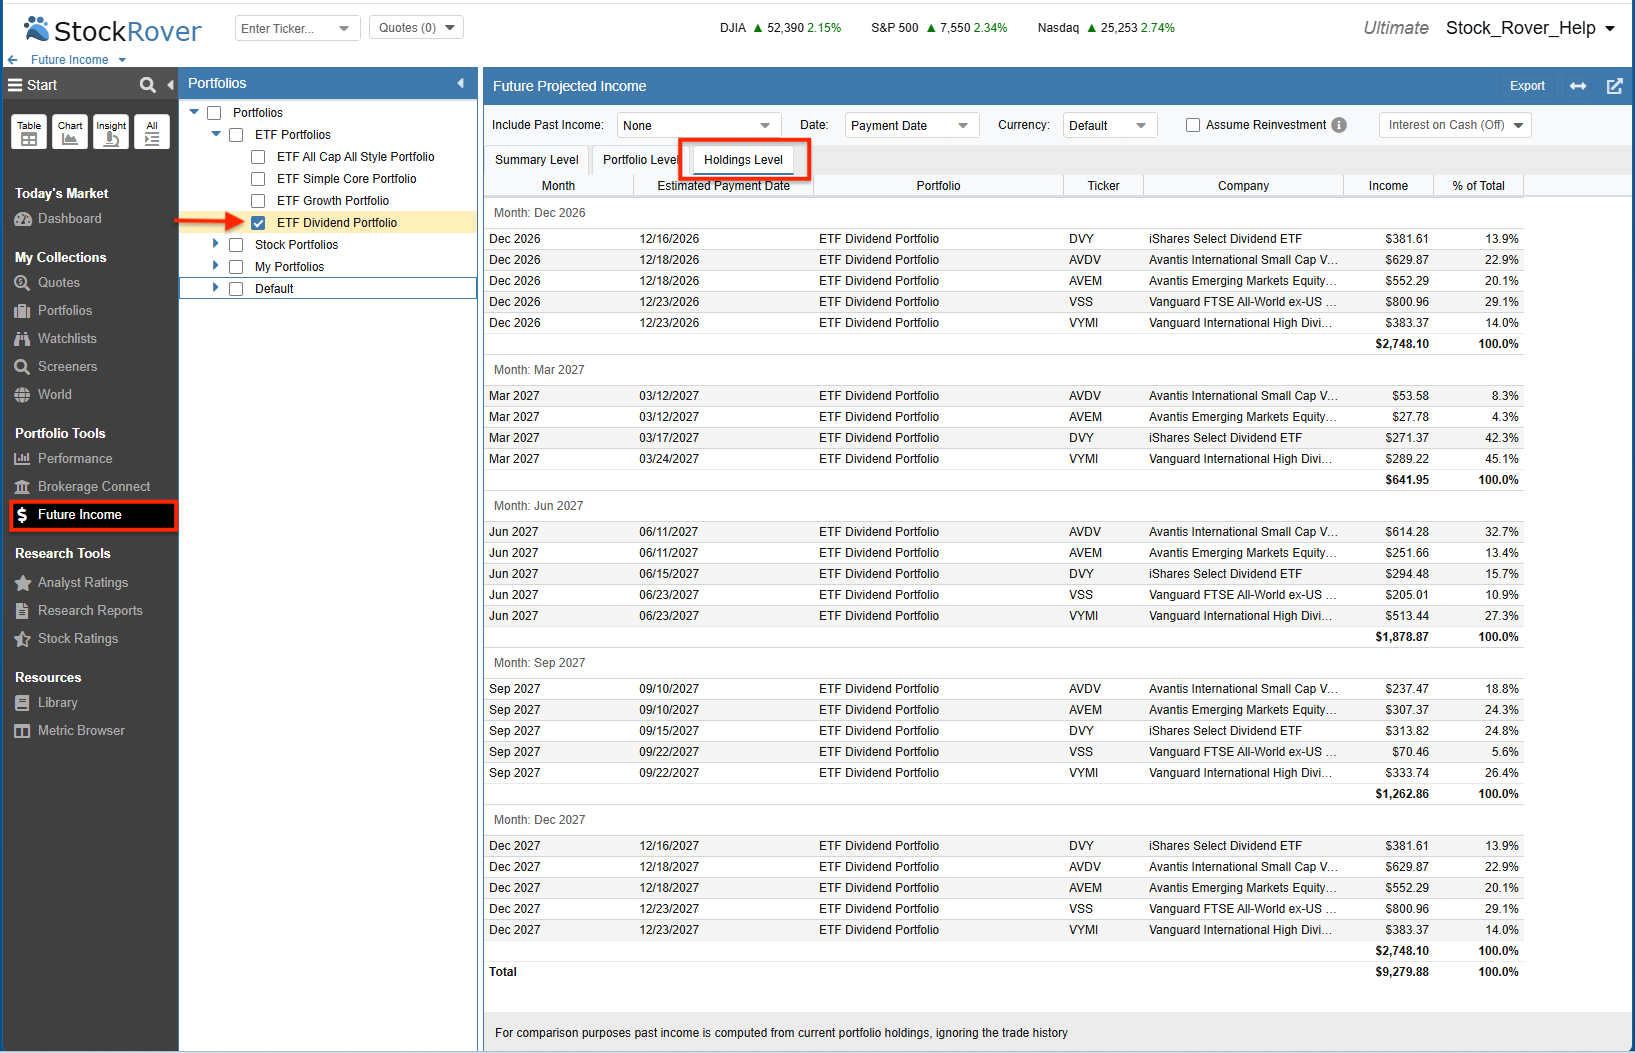
Project your upcoming monthly portfolio income.
Building a Smarter Portfolio
Building a resilient ETF portfolio requires more than finding a collection of funds. You need a process for finding quality ETFs, researching them in depth, understanding how they fit together, and monitoring the portfolio over time.
Stock Rover brings that entire workflow together, from screening and comparison to Fund Reports and portfolio analytics, so you can make more informed ETF decisions and better understand what you actually own.
Note: Certain features highlighted in this post are subscription-specific. You can compare all plan features here to find the best fit for your investing strategy.
ETF Investing: Frequently Asked Questions
Can I screen for specific ETF criteria like expense ratios and Morningstar ratings?
Yes, Stock Rover’s screener allows you to filter the ETF universe using hundreds of granular metrics, including expense ratios, AUM, historical performance, risk metrics, and Morningstar ratings.
How does Stock Rover help me avoid owning too much of the same stock across different ETFs?
Through the True Exposure tool inside the Portfolio Performance Report, Stock Rover mathematically unpacks your ETFs to show your actual, aggregate weighting in individual stocks, helping you instantly spot hidden concentration risk.
Can I track my ETFs alongside my mutual funds and individual stocks?
Absolutely. Stock Rover’s portfolio analytics and deep research tools seamlessly integrate ETFs, mutual funds, and individual stocks, giving you a unified view of your true asset allocation, correlation, and performance.