
Please see our screener help section for instructions on creating a new screener.
Screener Strategies
Stock Rover brings together deep fundamental data, powerful screening, smart portfolio management, and real-time analysis into a single, unified workspace designed for serious investors
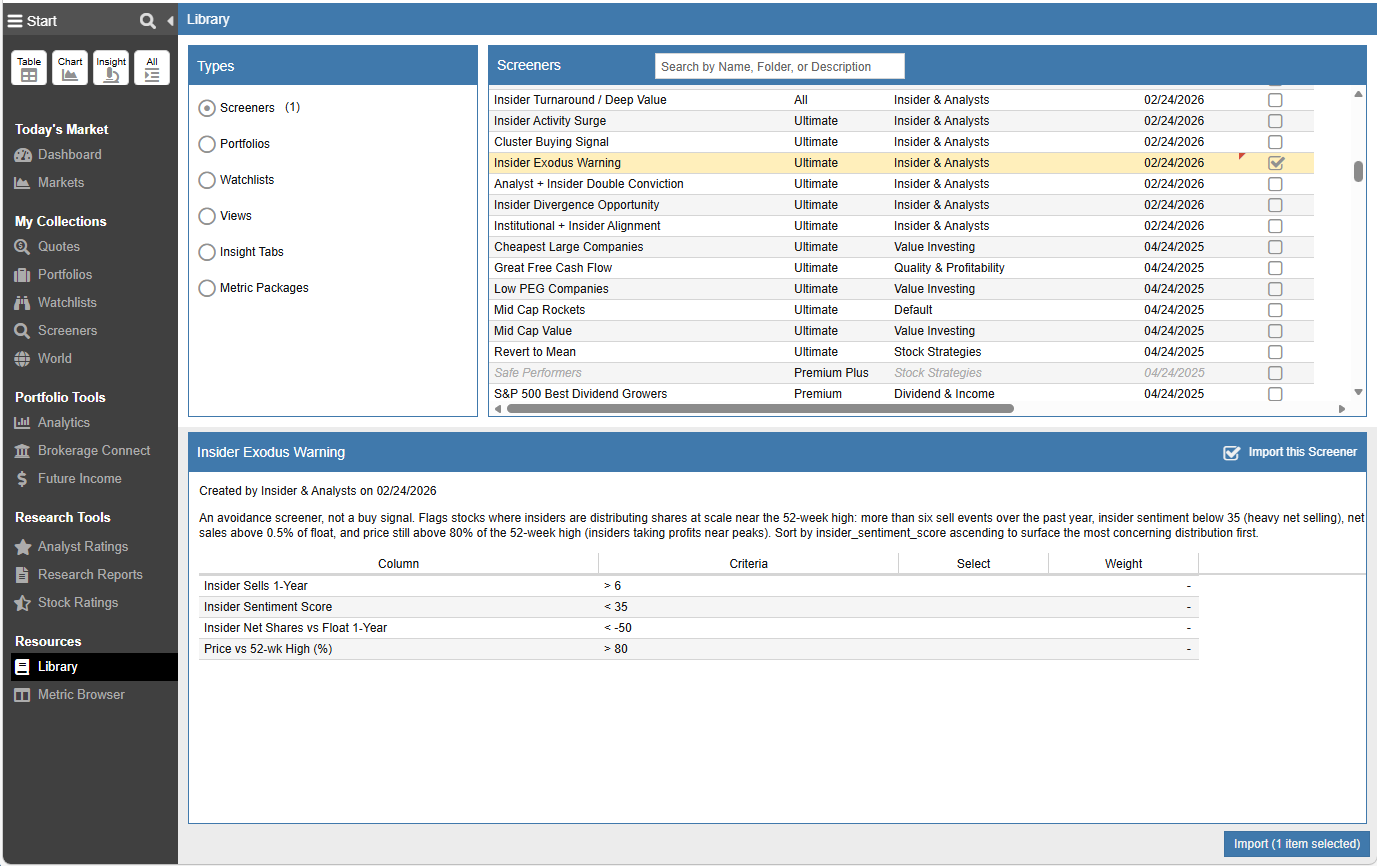
Stock Rover includes a comprehensive library of prebuilt screeners that investors can use immediately. These screeners cover a wide range of investing strategies and methodologies, allowing users to quickly deploy proven models without building them from scratch.
From there, investors can modify any existing screener or build entirely new strategies tailored to their own investment approach. Stock Rover also supports advanced screening capabilities, including screening against historical metrics, ranked results, and scoring portfolios or watchlists against a screener’s criteria.
Once a screener is created, users can analyze the results in multiple ways—from reviewing the output of a single screener, comparing multiple screeners side-by-side, or evaluating how individual tickers perform across different strategies.
Jumpstart your research with 150+ prebuilt screener strategies covering a wide range of investing methodologies. These ready-to-use screens allow you to instantly deploy strategies such as:

Identify companies using approaches like Growth at a Reasonable Price (GARP), deep value investing, or consistent earnings growth.
Secure consistent passive income using screeners built around sustained dividend growth and optimal payout metrics.
Run models based on legendary investors such as Buffett, Lynch, and Greenblatt, along with proven academic formulas like the Piotroski F-Score, Altman Z-Score, and Beneish M-Score.
Track executive conviction using screeners built around insider transaction data.
If you have a specific investment strategy, Stock Rover provides the tools to build a screener around it.
Screen across more than 14,000+ North American Stocks and 7000+ ETFs using 800+ financial, operational, and pricing metrics.
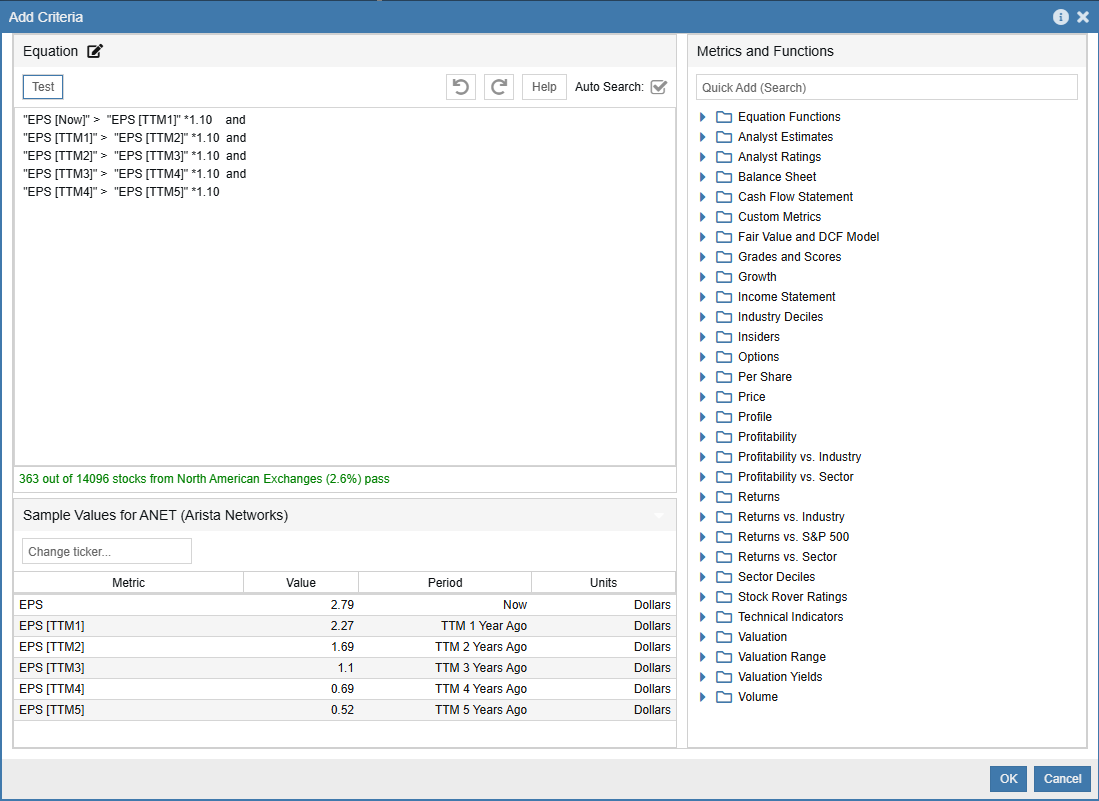
Go beyond current metrics by creating custom equations that evaluate up to 20 years of fundamentals and historical performance.
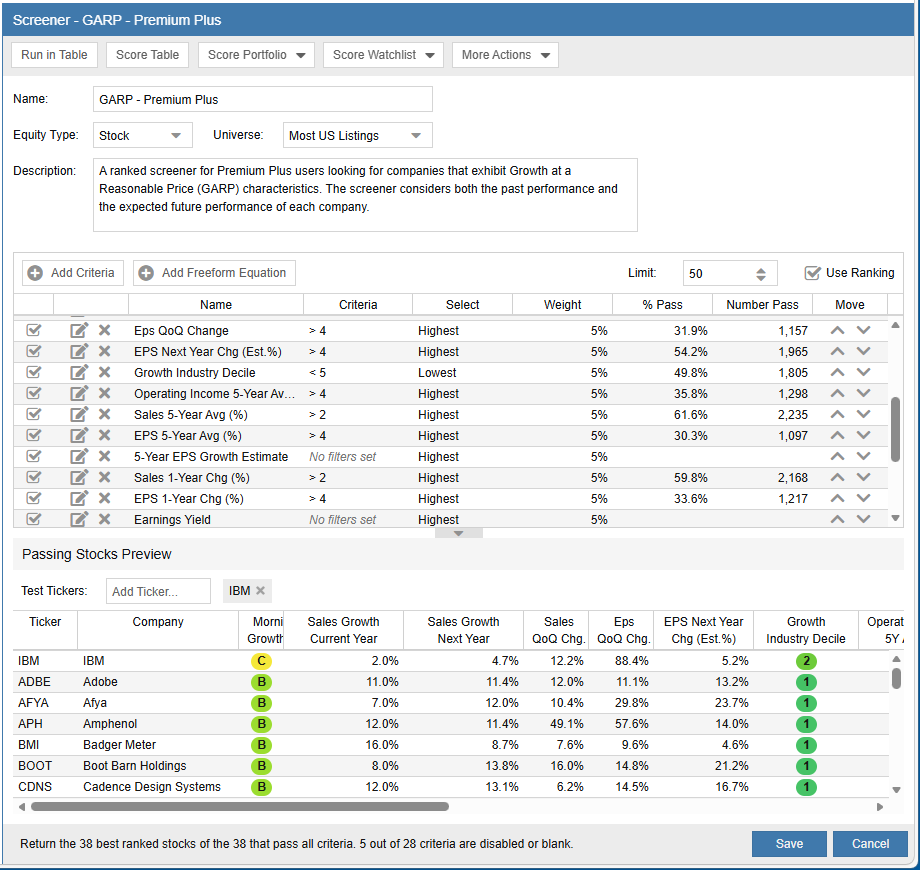
A successful screener shouldn’t just return a list of passing stocks—it should help you identify the best candidates
Assign custom weights to the metrics that matter most to your specific strategy.
Rank Results by What Matters Most – Not all screening criteria carry the same importance. With Stock Rover, you can assign weights to each metric, allowing your screener to emphasize the factors that matter most to your strategy.
By weighting these criteria, Stock Rover automatically ranks passing companies based on how well they align with your strategy, helping you focus on the most compelling candidates first
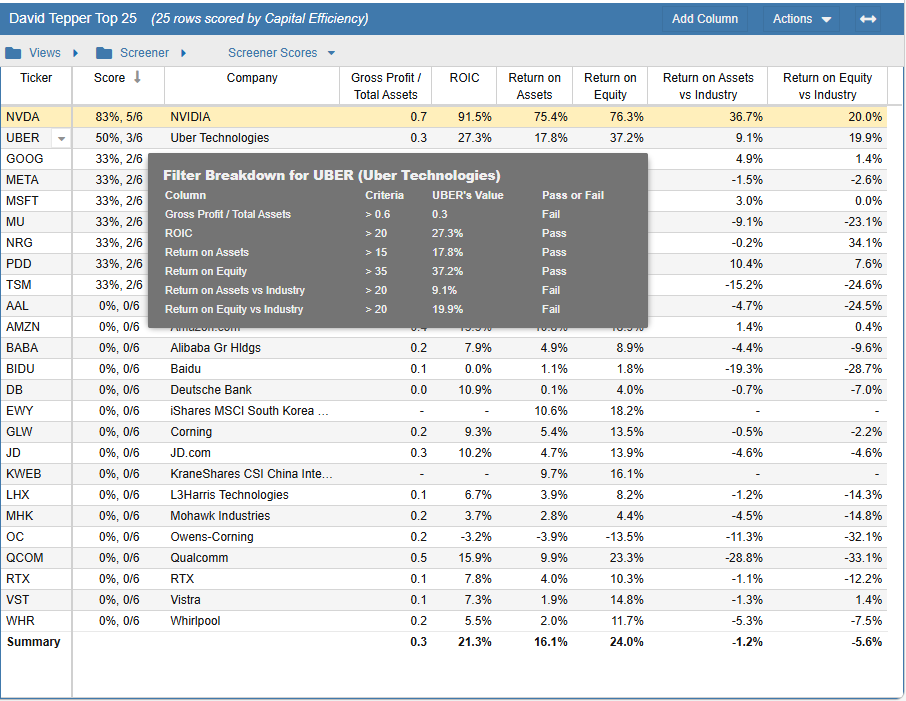
Ranking helps you sort screener results, but scoring takes the analysis one step further.
Stock Rover can score any group of stocks—whether from a screener, portfolio, or watchlist—against the criteria of your screener’s strategy.
Instead of manually analyzing dozens of metrics, scoring distills your strategy into a single, easy-to-interpret result that shows how closely a stock aligns with your investment mode
Ranking and scoring transform screeners from simple filters into repeatable research frameworks.
Once you define your criteria, Stock Rover continuously evaluates companies against that framework—allowing you to:
The result is a screening process that is systematic, transparent, and scalable, helping investors move from raw data to high-conviction ideas faster.
After creating a strategy, the next step is evaluating how well it performs.
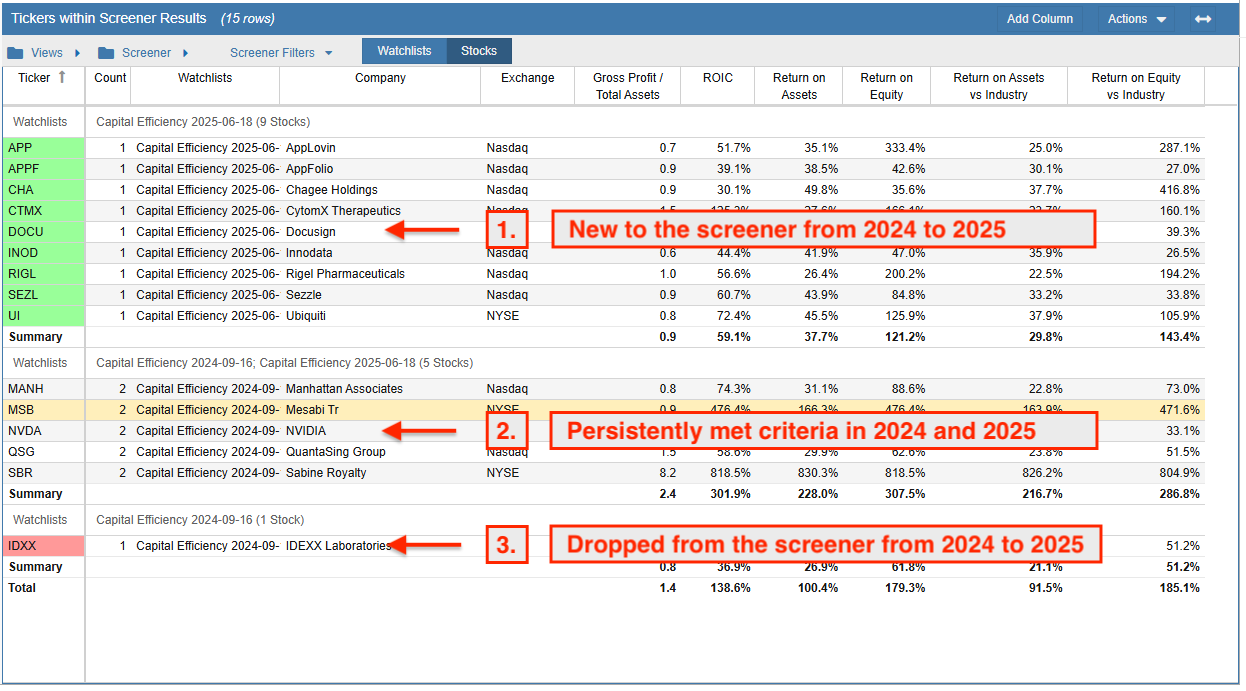
Lets you compare the results of a screener across different points in time or against other screeners. This makes it easy to see how your investment criteria perform and evolve.
Load multiple screener results into the Stock Rover table to compare strategies and identify stocks that pass several approaches.
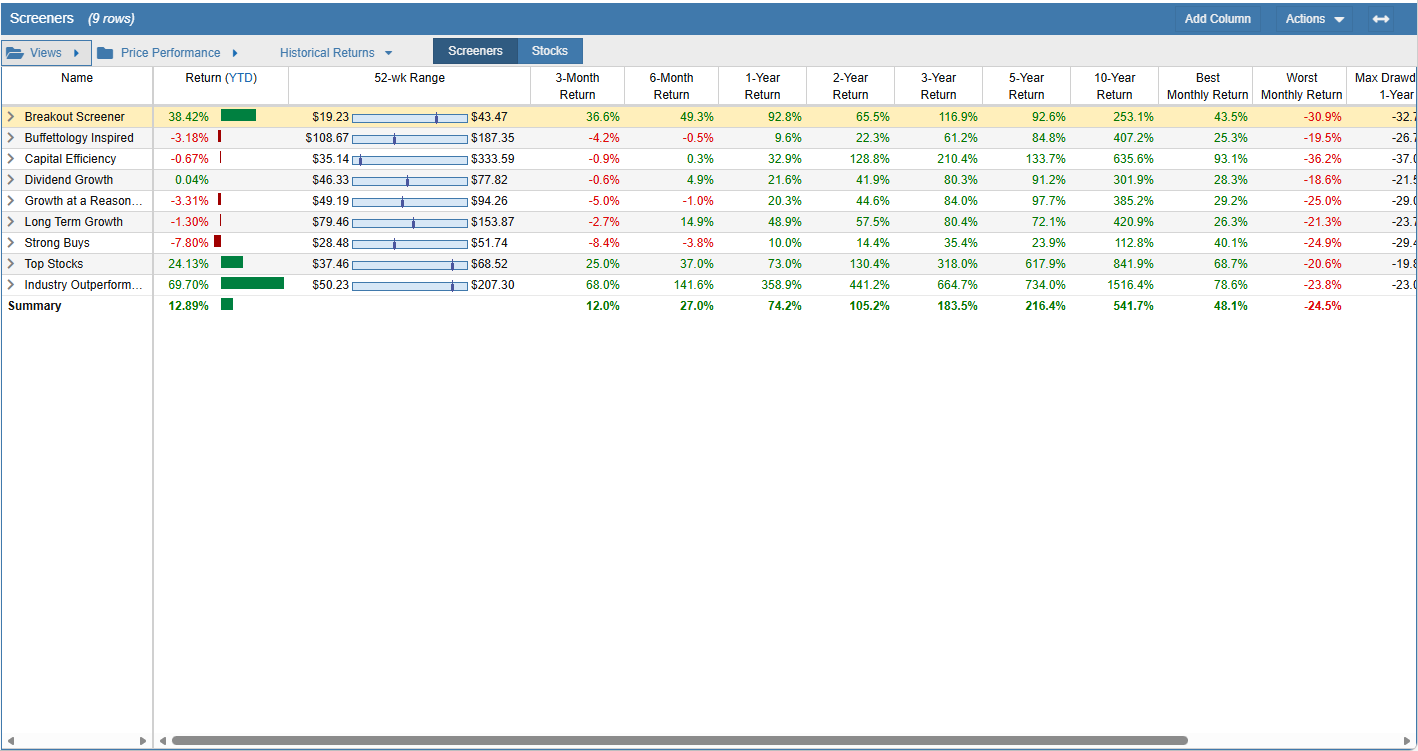
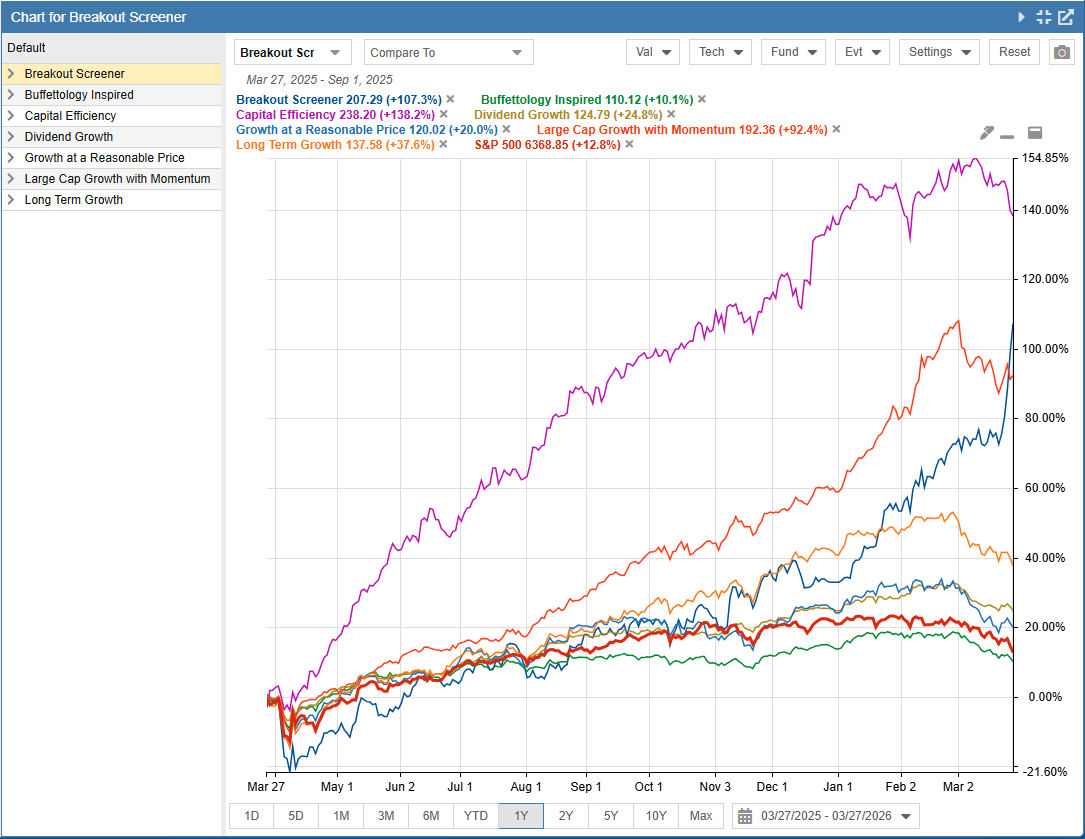
Compare your screener results against benchmarks like the S&P 500 to instantly analyze pricing momentum, and verify consistent long-term performance.
Didn’t answer your question? See our help pages, or email us at support@stockrover.com.
Please see our screener help section for instructions on creating a new screener.
Please see our screener help section for instructions on updating screener.
You can run multiple screeners together, displaying the tickers that pass all of the selected screeners.
Please see our screener help section for instructions on how to running multiple screeners together.
A screener is a set of rules for narrowing the investable universe of stocks down to a much smaller set of stocks that you are interested in researching further based on their financial metrics and/or price performance. A screener is typically made up of a set of filters, and a stock must pass all filters to be included in screener results.
A ranked screener is an advanced type of screener that adds in a weighting option, so that in addition to creating filters, you can also weight certain criteria (weights must add up to 100%). The weights allow Stock Rover to score and rank stocks so that you can see which stock most closely matches the criteria you designate as being important. A key advantage of ranked screening criteria is that they allow you to narrow the universe of stocks to a more digestible population (like regular screeners), but they do so without requiring strict absolute filters.
Weights can also be applied to a portfolio or watchlist so that the stocks in that population can be ranked according to the weighted criteria. Learn more about how they work on our help site.
The maximum number of screeners you can create depends on your subscription tier:
Please see our Compare Plans page for a complete list of differences between the subscriptions.
All default screeners can be imported from the Investors’ Library. More information on importing from the library can be found in the here.
Screener results can be saved as a portfolio or watchlist by selecting Save As from the Table’s Actions menu. Because screeners evaluate current market data, your results will change dynamically over time.
You can also export your screener results to a CSV file for use in a spreadsheet.
For more details, please see Save Screener Results.
While we do not currently have a dedicated backtesting feature, we are considering it for a future release. In the meantime, subscribers on our Premium plus, Ultimate, and Ultimate Pro plans can create a backtesting-like screener using historical data via the equation screener.
This workaround allows you to see how stocks that met your screening criteria in the past have performed since then. Please note that historical screening is limited to metrics with available historical data and does not account for market factors like survivorship bias.
Stock Rover charts the return values of the tickers that currently pass a screener’s criteria as a group. The tickers that pass the screener are charted as if it were a portfolio with an equal dollar weighting for each holding. Additionally, via internal rebalancing, the equal weighting is maintained each day of the period that the screener is charted.
Yes, custom metrics can be used to screen stocks! This feature is available to Premium plus, Ultimate, and Ultimate Pro subscribers. Please note that while they work great for standard screening, custom metrics cannot be weighted within a ranked screener.
To learn more about creating and using them, see our Custom Metrics documentation.