Stock and ETF Comparison
Stock Rover brings together deep fundamental data, powerful screening, smart portfolio management, and real-time analysis into a single, unified workspace designed for serious investors.
Make smarter investment decisions by comparing stocks and ETFs side-by-side. Stock Rover’s comparison tools bring together 20 years of fundamental history, technical data, and institutional intelligence into a single, intuitive view. Whether you are benchmarking against the market or auditing insider activity, you will have the clarity needed to identify the strongest opportunities.
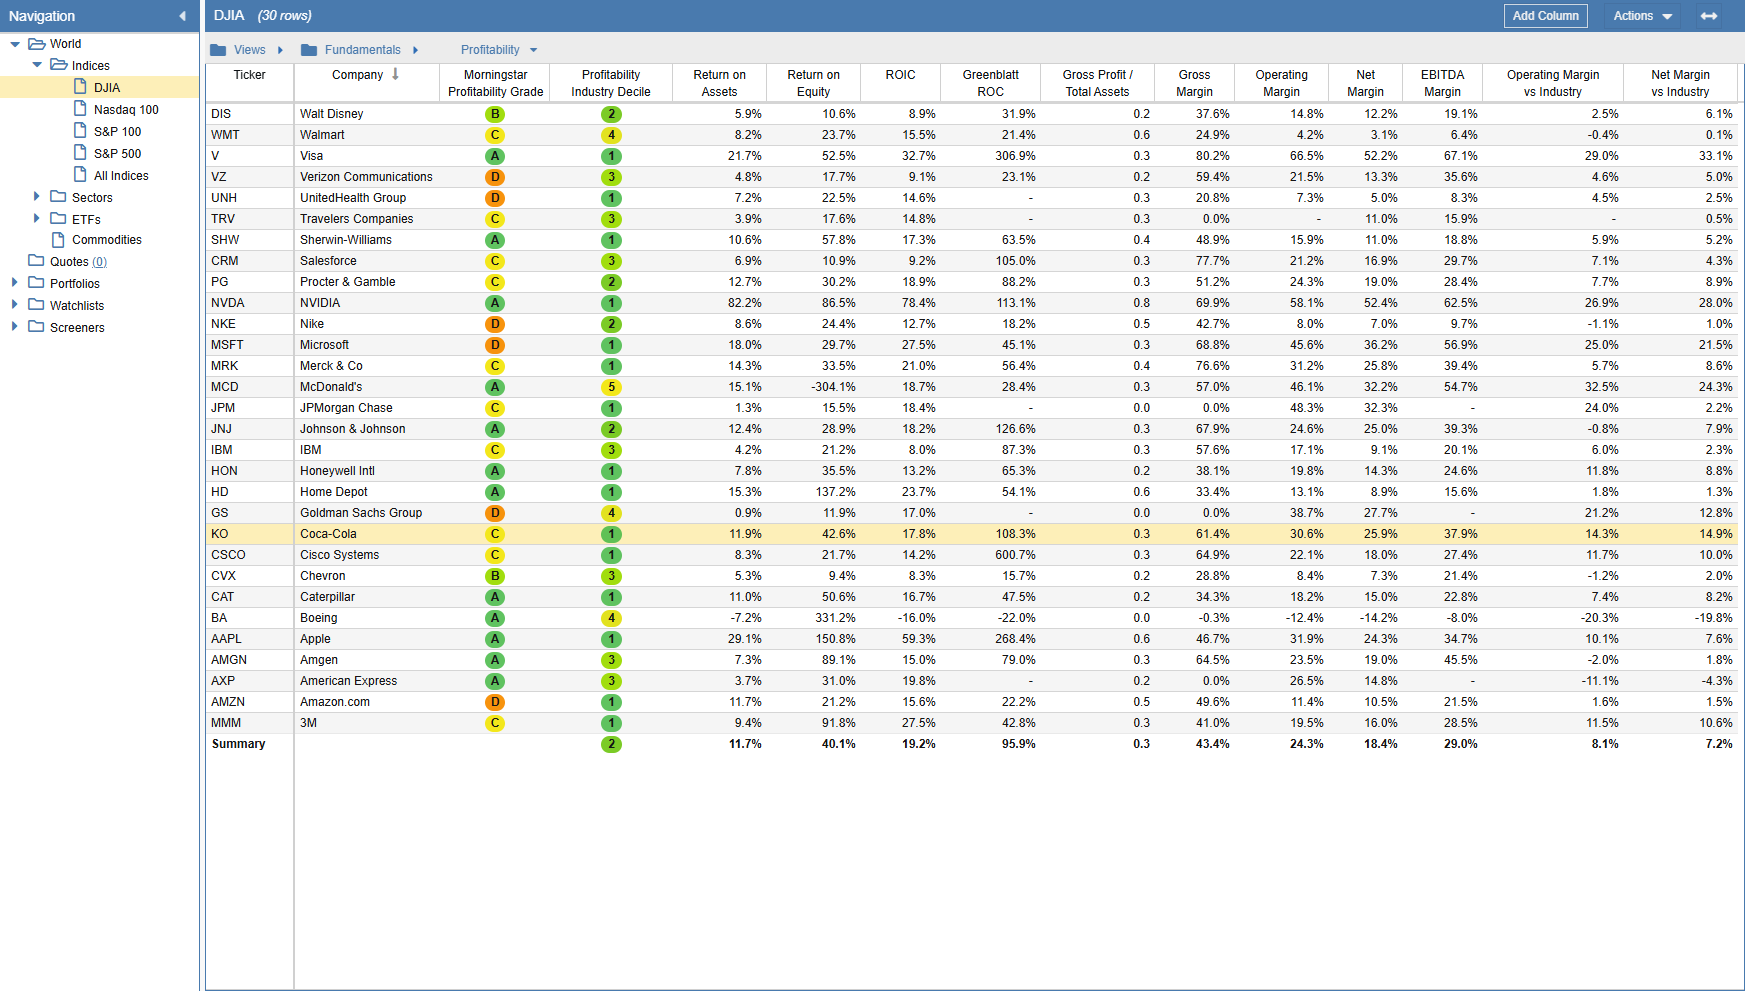
The Table view isn’t just a list, it’s your analytical workspace it’s where you do your deep research. Compare the stocks or ETFs that passed your screen side-by-side across hundreds of data columns, proprietary Stock Rover ratings, and 20+ years of historical financials. Whether you load up an expertly crafted default view or customize the layout to match your exact strategy, the Table adapts to your workflow. Sort, filter, and score your results to instantly spot the fundamental outliers.
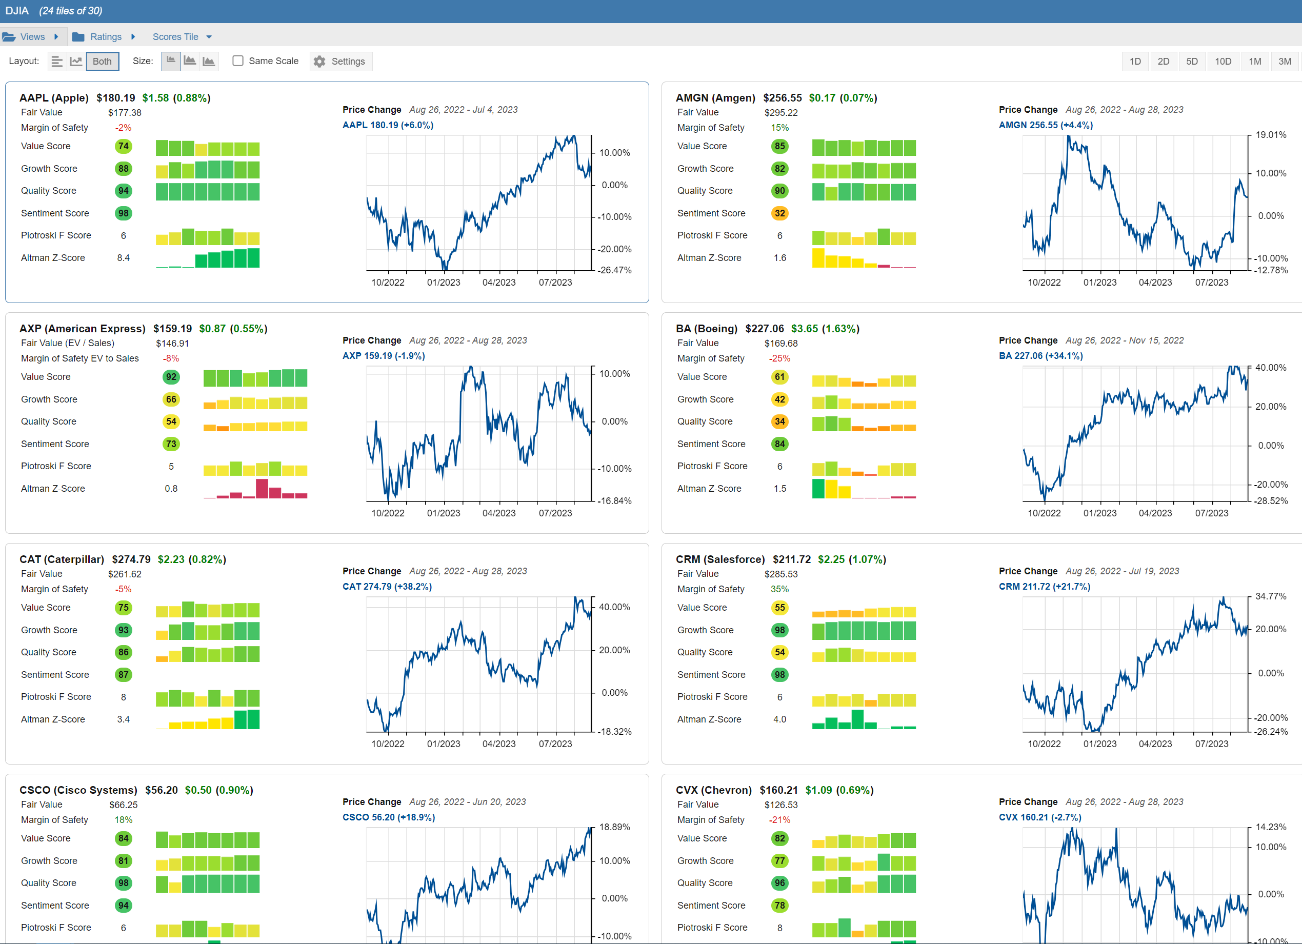
Prefer a visual summary? Compare multiple stock tiles side-by-side. Combine fundamental data with interactive pricing or fundamental charts, and fully configure the metrics displayed in each tile to instantly spot trends without getting lost in the weeds.
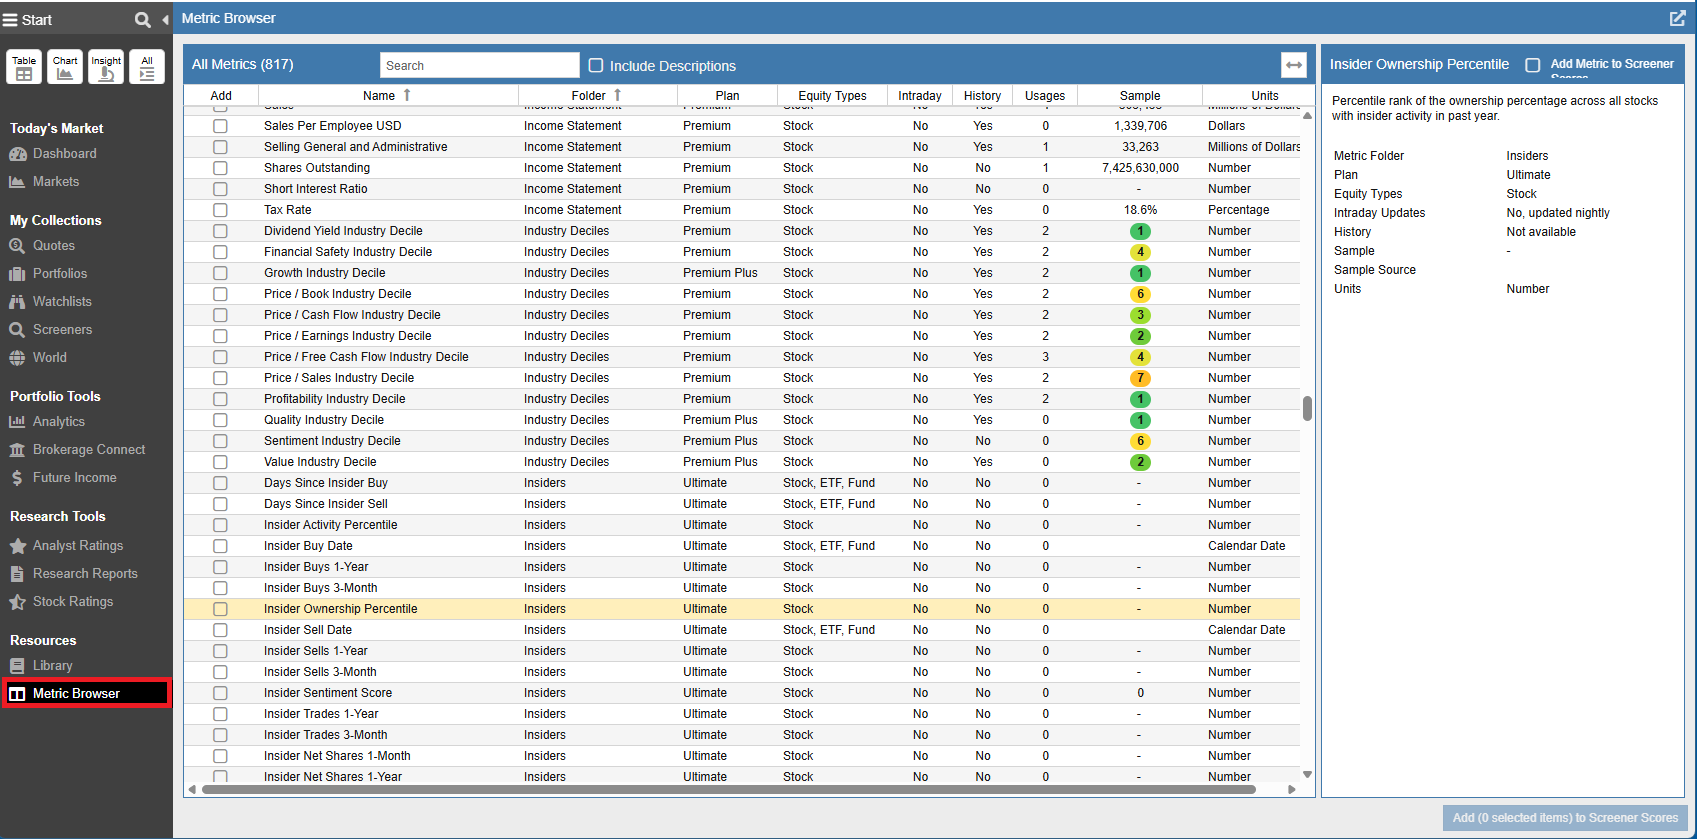
Never hit a wall in your analysis. Access a massive library of financial, operational, and pricing data, ensuring you have exactly the right metrics to uncover deep fundamental insights without compromise.
Jumpstart your research with 150+ prebuilt screener strategies covering a wide range of investing methodologies. These ready-to-use screens allow you to instantly deploy strategies such as:
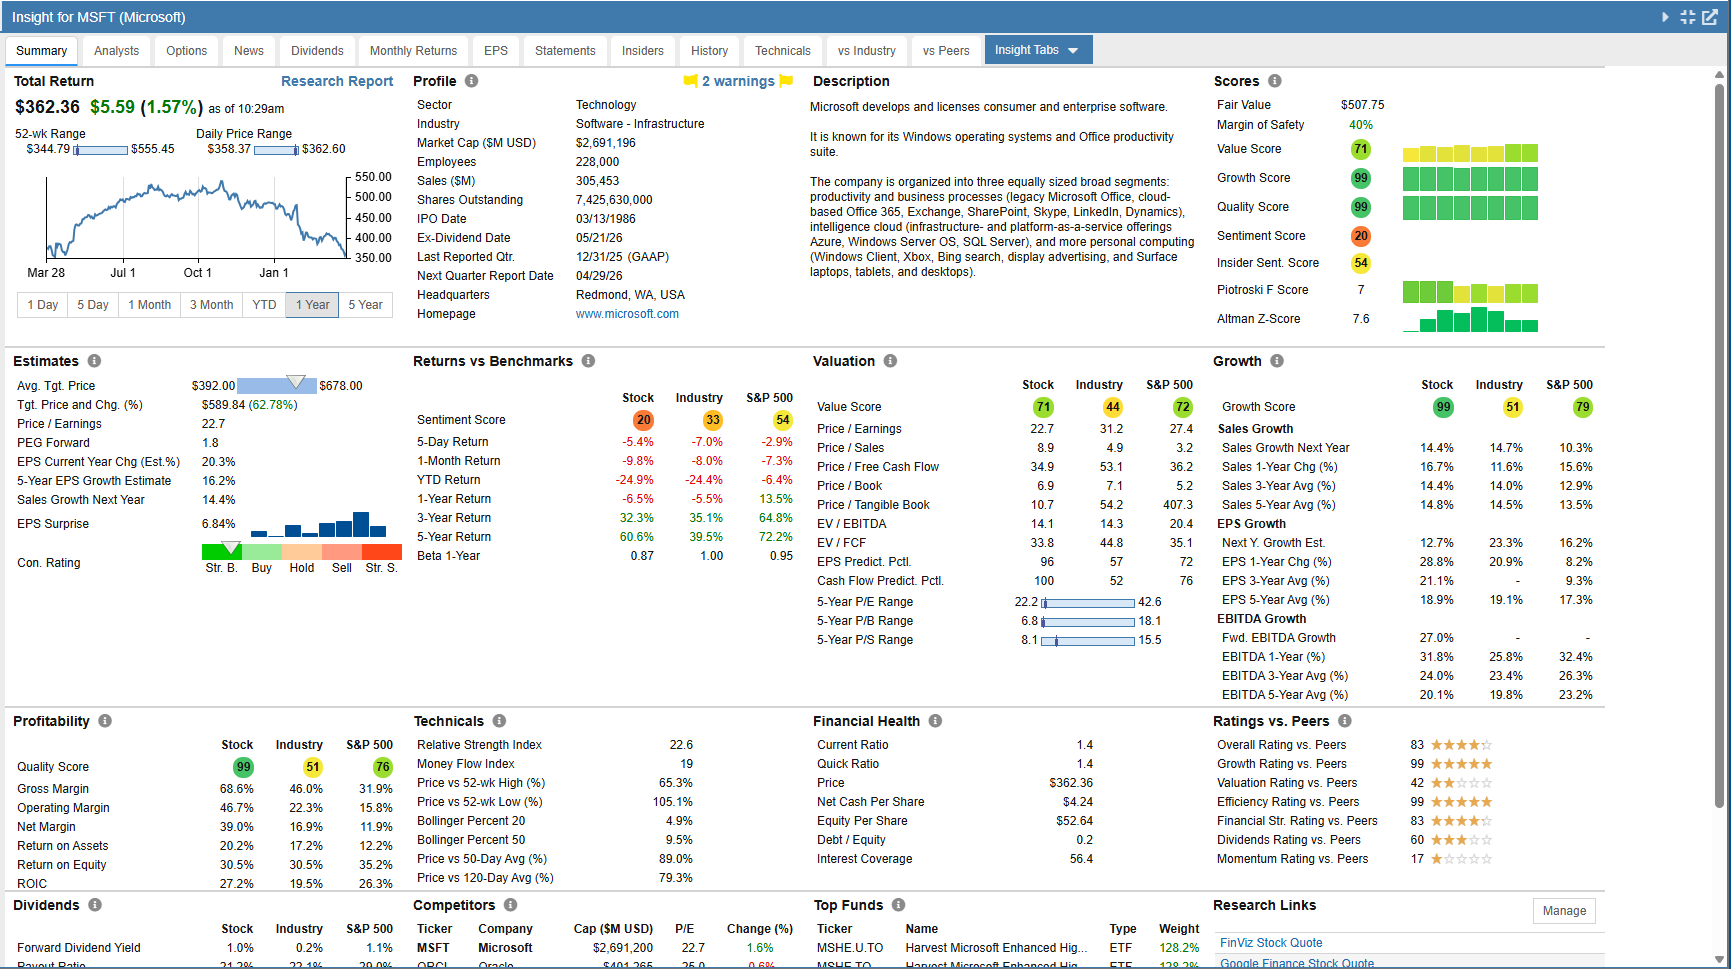
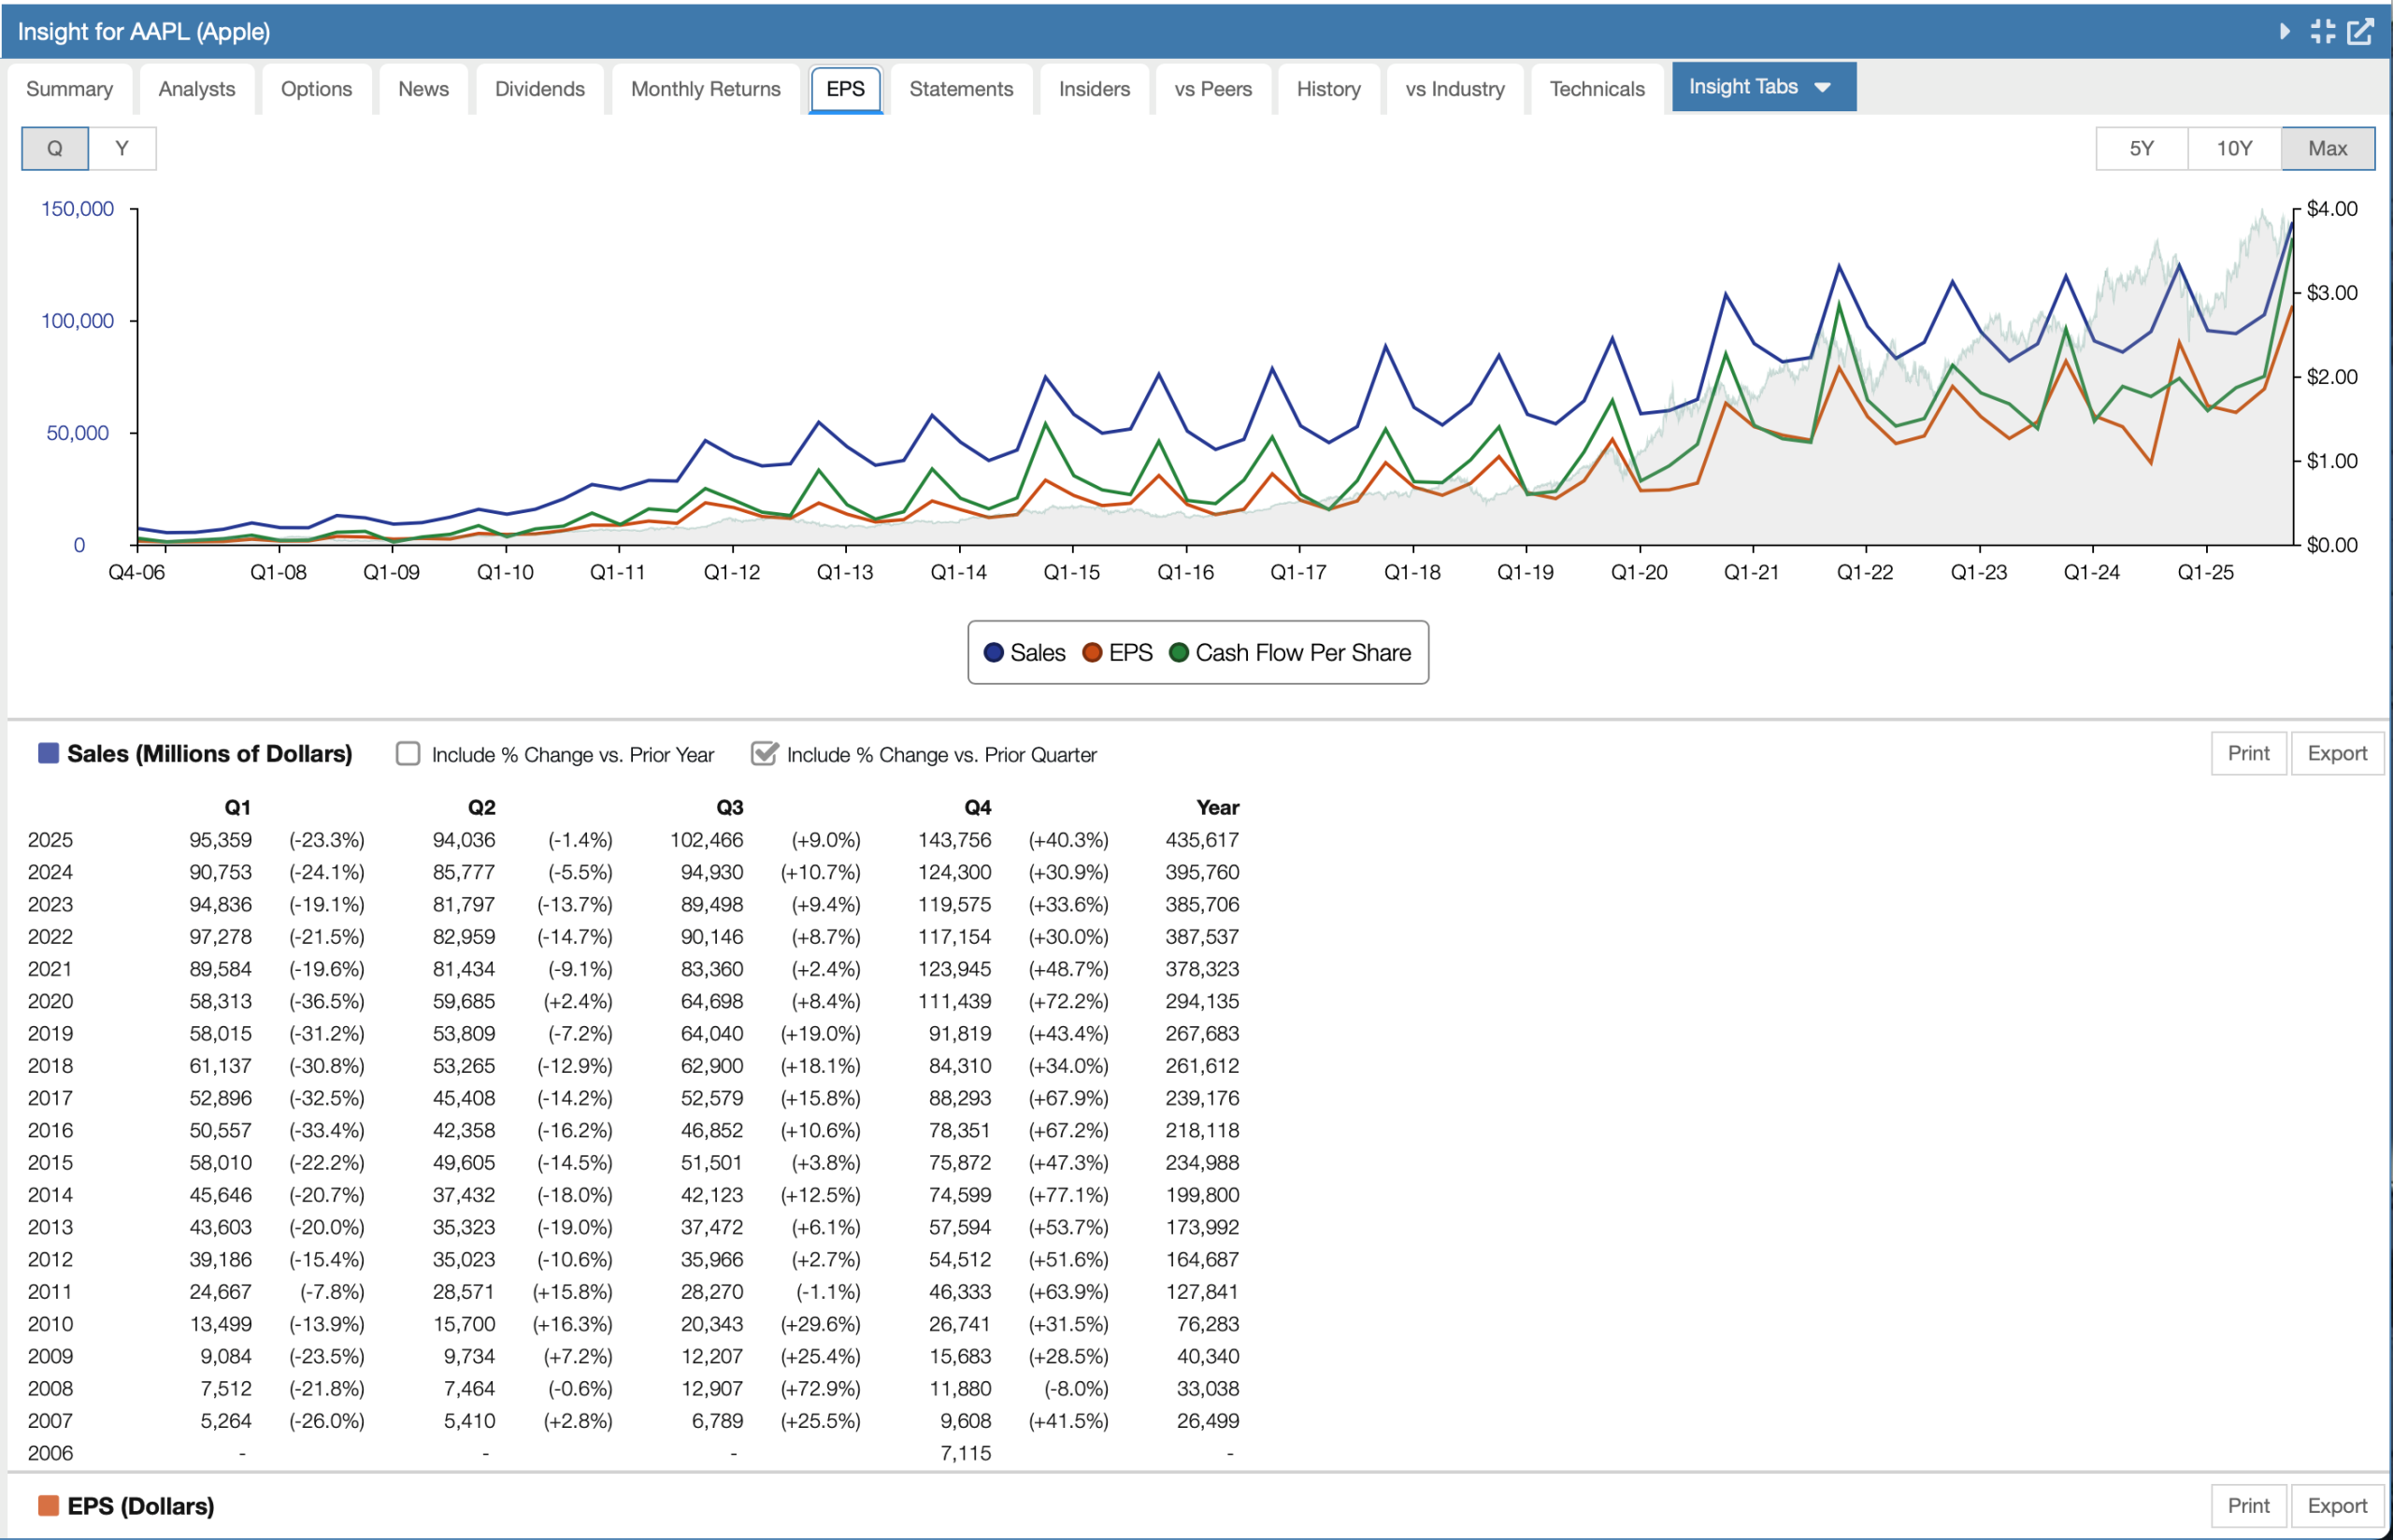
Your command center for a specific ticker. Instantly view detailed fundamental data, sales, earnings, cash flow, and dividend analysis in one cohesive panel.
Analyze company performance and financial health through multiple market cycles and economic shifts with two decades of historical fundamental data.
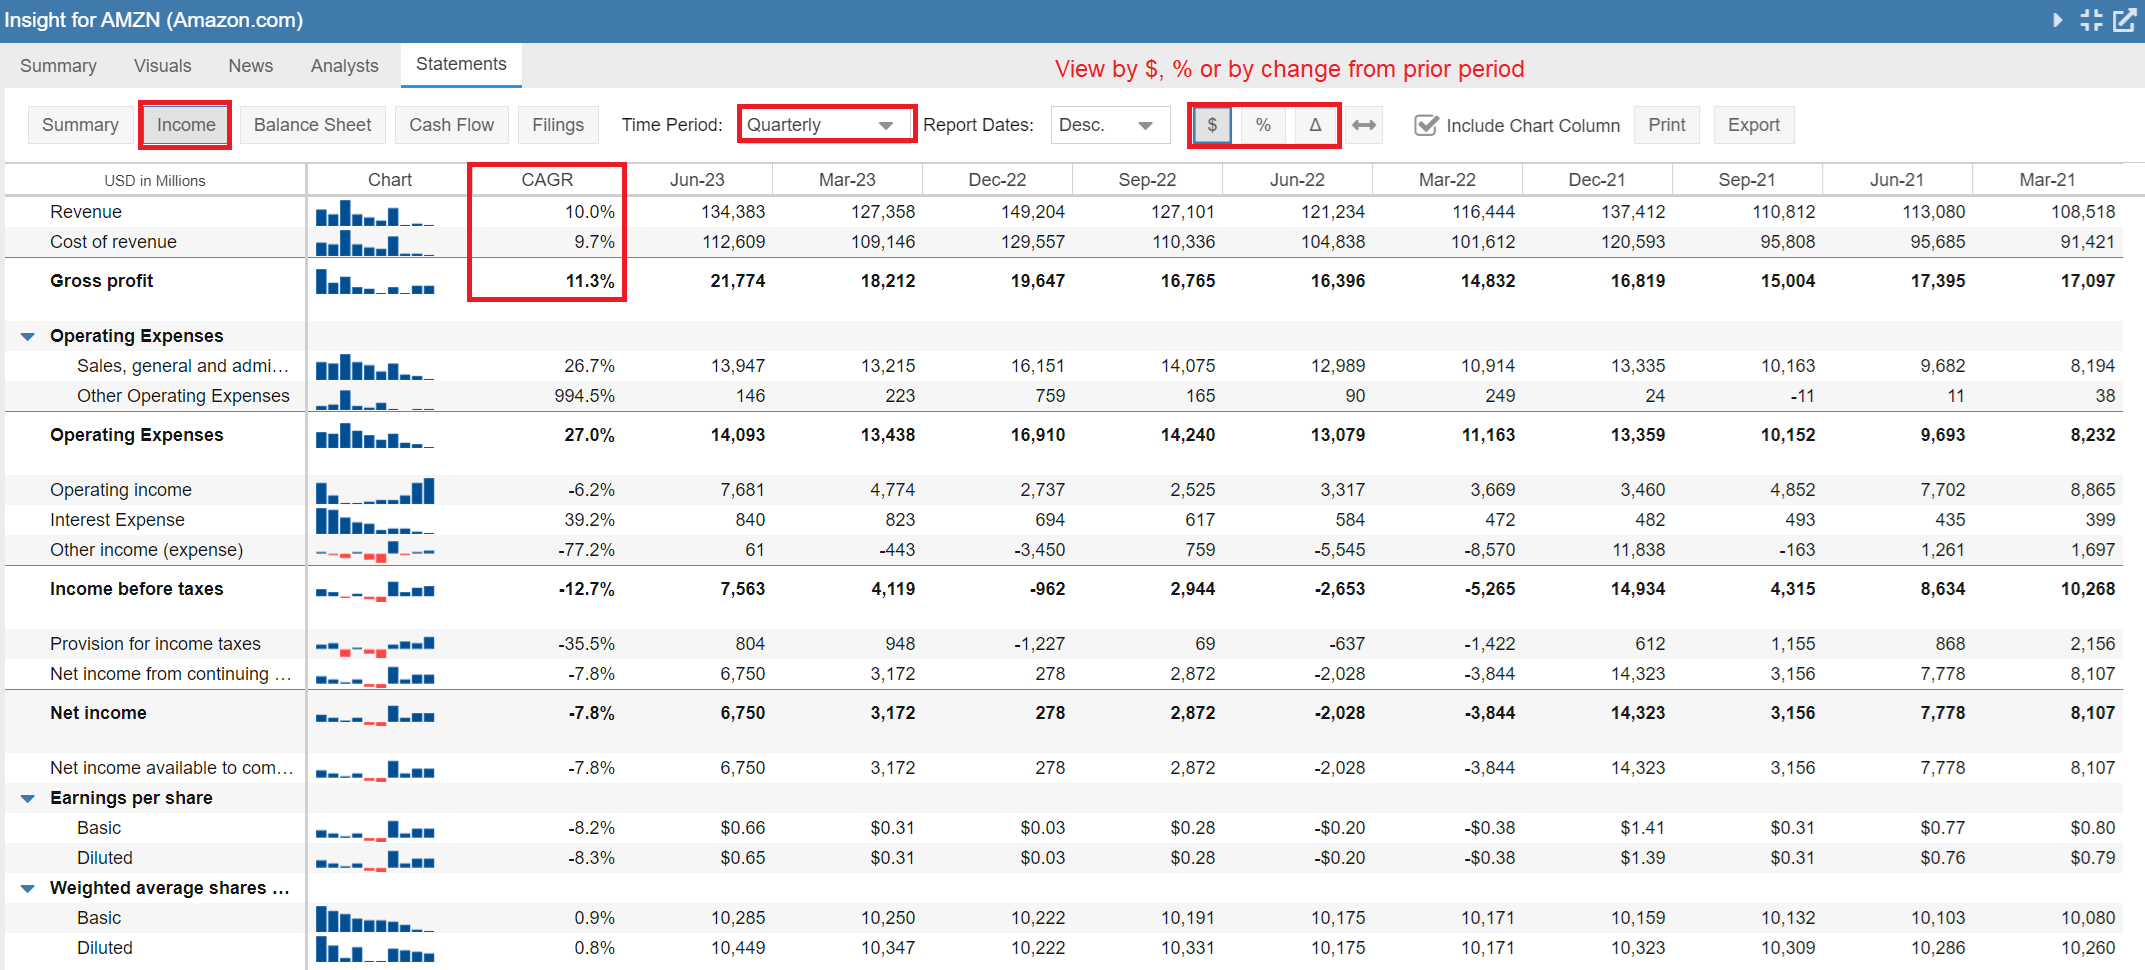
Compare year-over-year or quarter-over-quarter performance across 20 years. View statements on a percentage basis or calculate the Compound Annual Growth Rate (CAGR) to easily normalize and compare companies of different sizes.
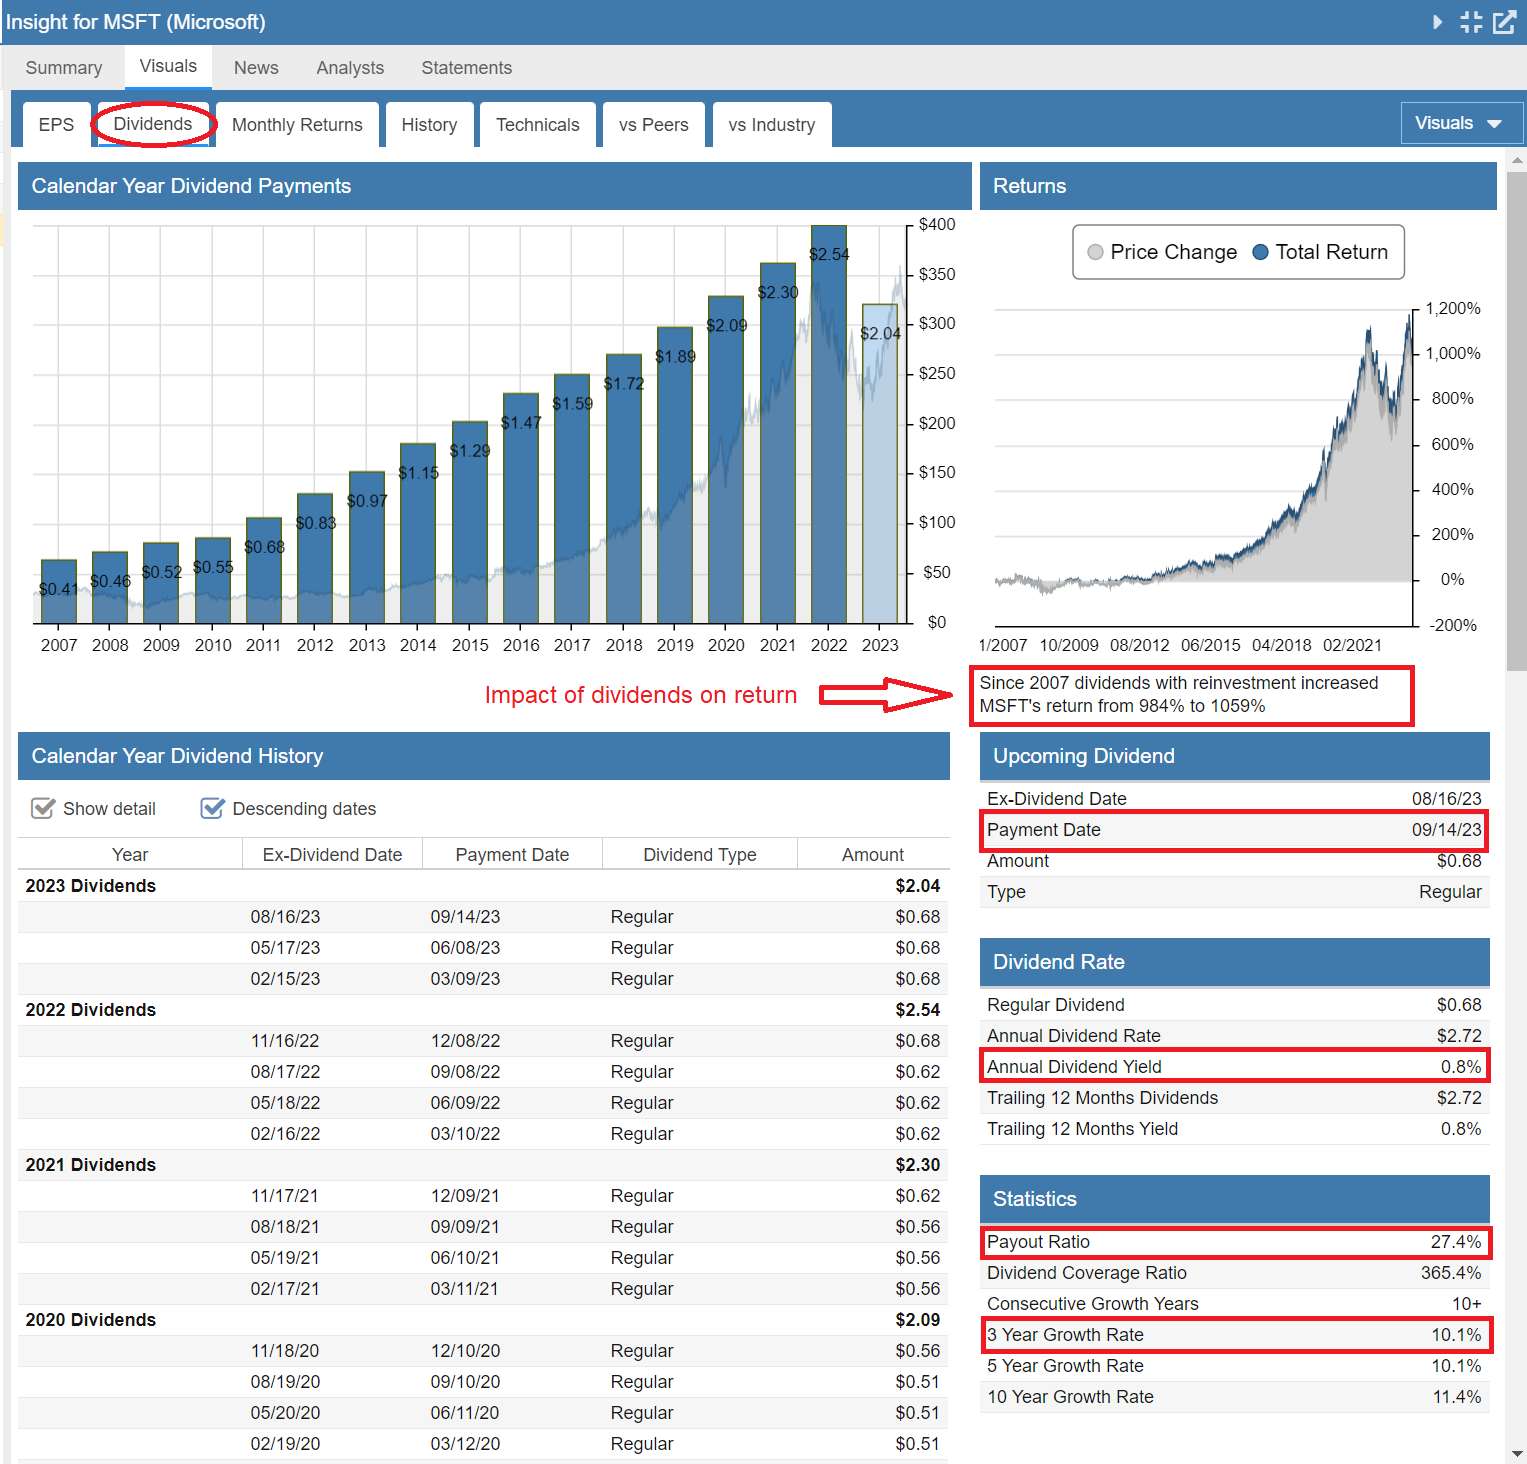
Analyze a stock’s dividend yield, safety, coverage, and historical growth over time to ensure your income stream is secure.
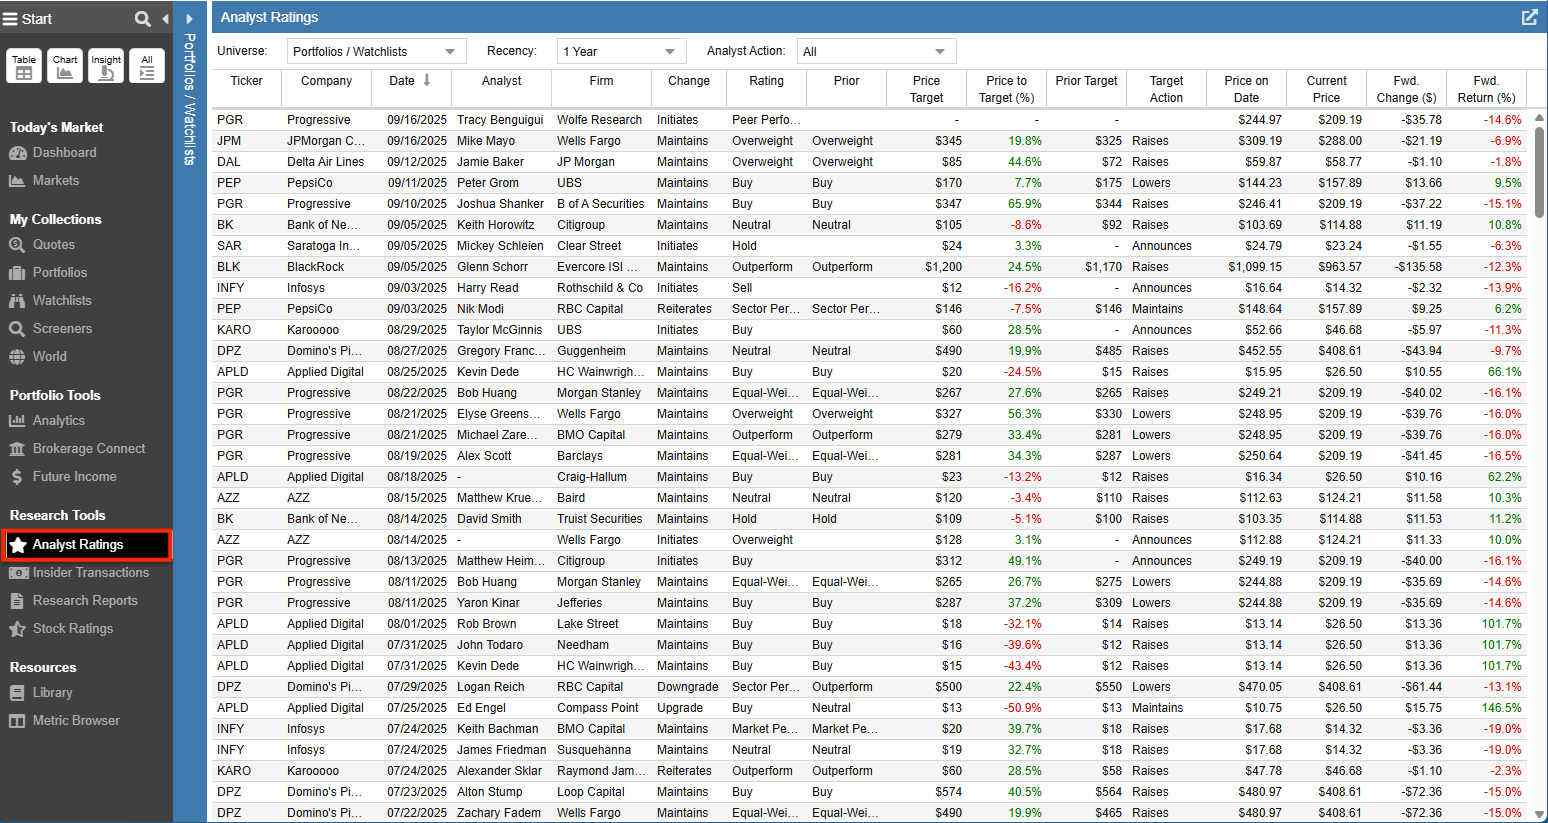
Analyst upgrades and downgrades can drive market changes, but a single “consensus score” doesn’t tell the whole story. Stock Rover helps you get a clearer picture by combining ratings and price target changes into a single, highly configurable view.
Corporate insiders know their companies better than anyone, and insider purchases can sometimes signal executive confidence in a company’s prospects. Stock Rover unlocks this ‘smart money’ data by aggregating trades by corporate officers and directors, giving you a clear view of who is buying, who is selling, and when.
Knowing what a stock is worth is only half the battle; knowing the risks is what keeps you profitable.
Stock Rover automatically calculates the Fair Value and Margin of Safety for all stocks in its universe, helping you spot underpriced opportunities instantly.
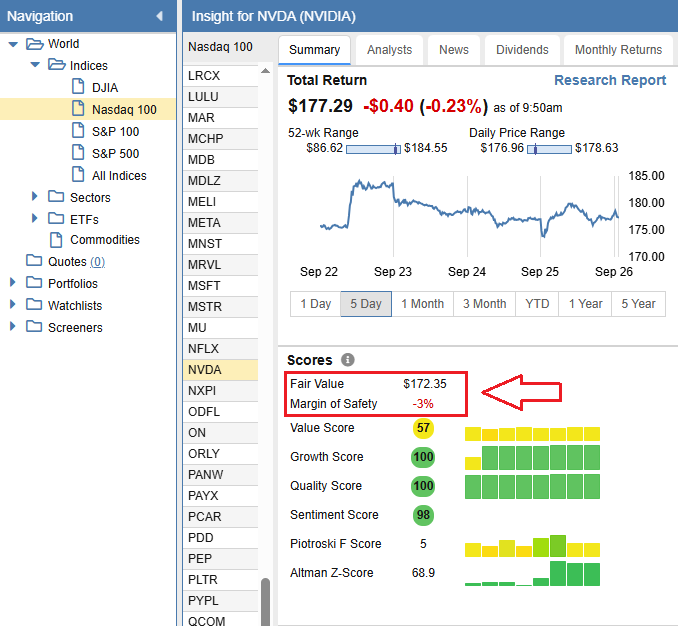
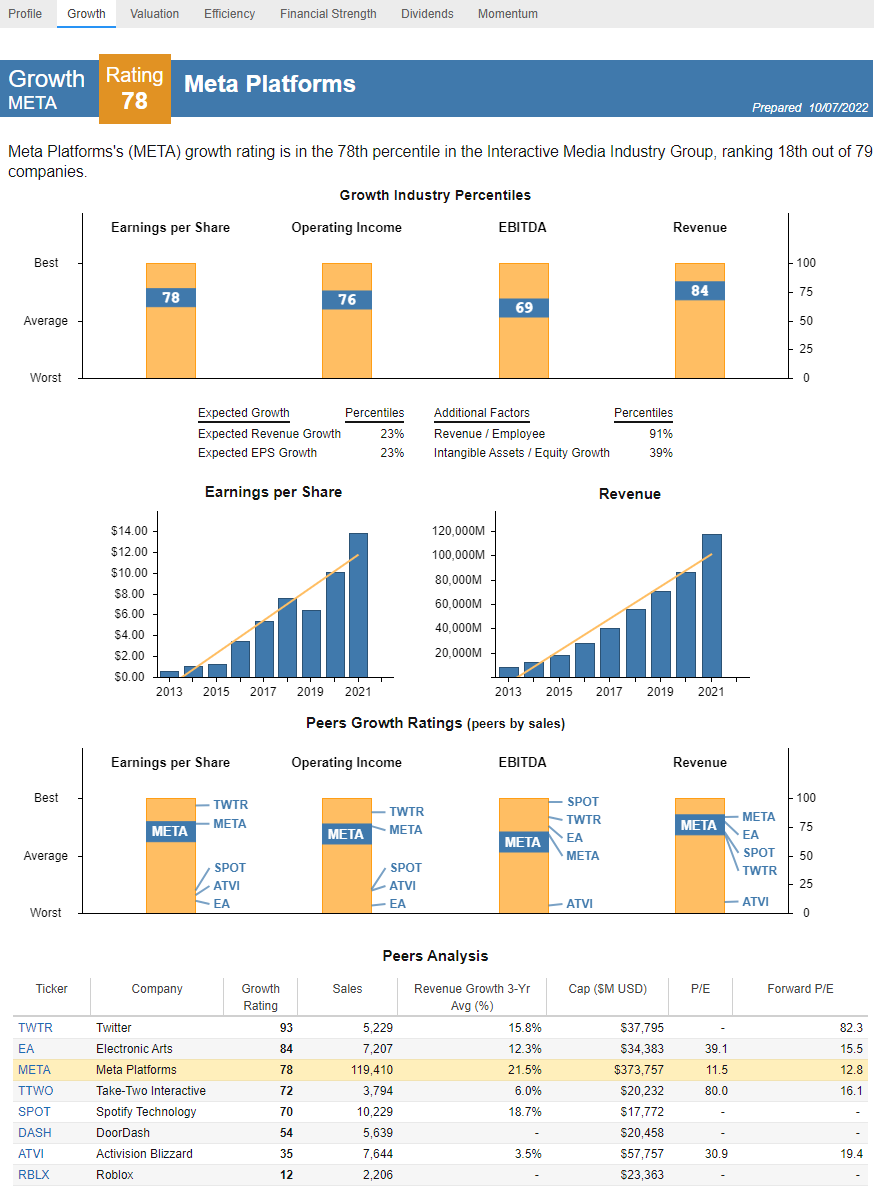
Distill complex historical data into simple percentile grades (1-100) vs. peers in key areas like growth, valuation, efficiency, and momentum.
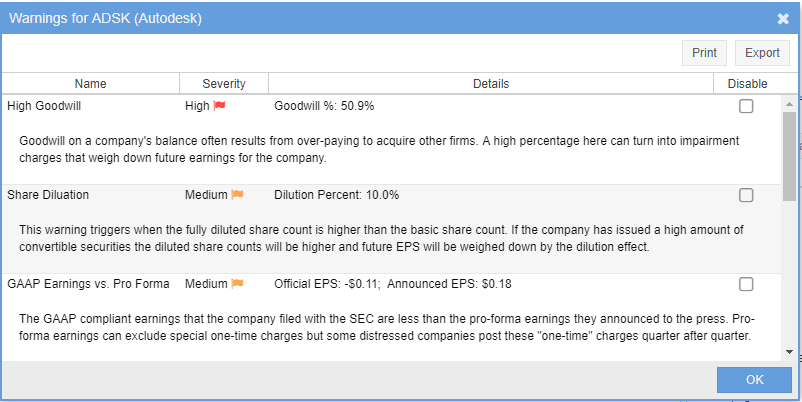
Never overlook a red flag again. We automatically check for concerning trends like declining sales, high leverage, or bloated goodwill, and alert you before you make a costly mistake.
Didn’t answer your question? See our help pages, or email us at support@stockrover.com.