Holdings Detail
Introduction
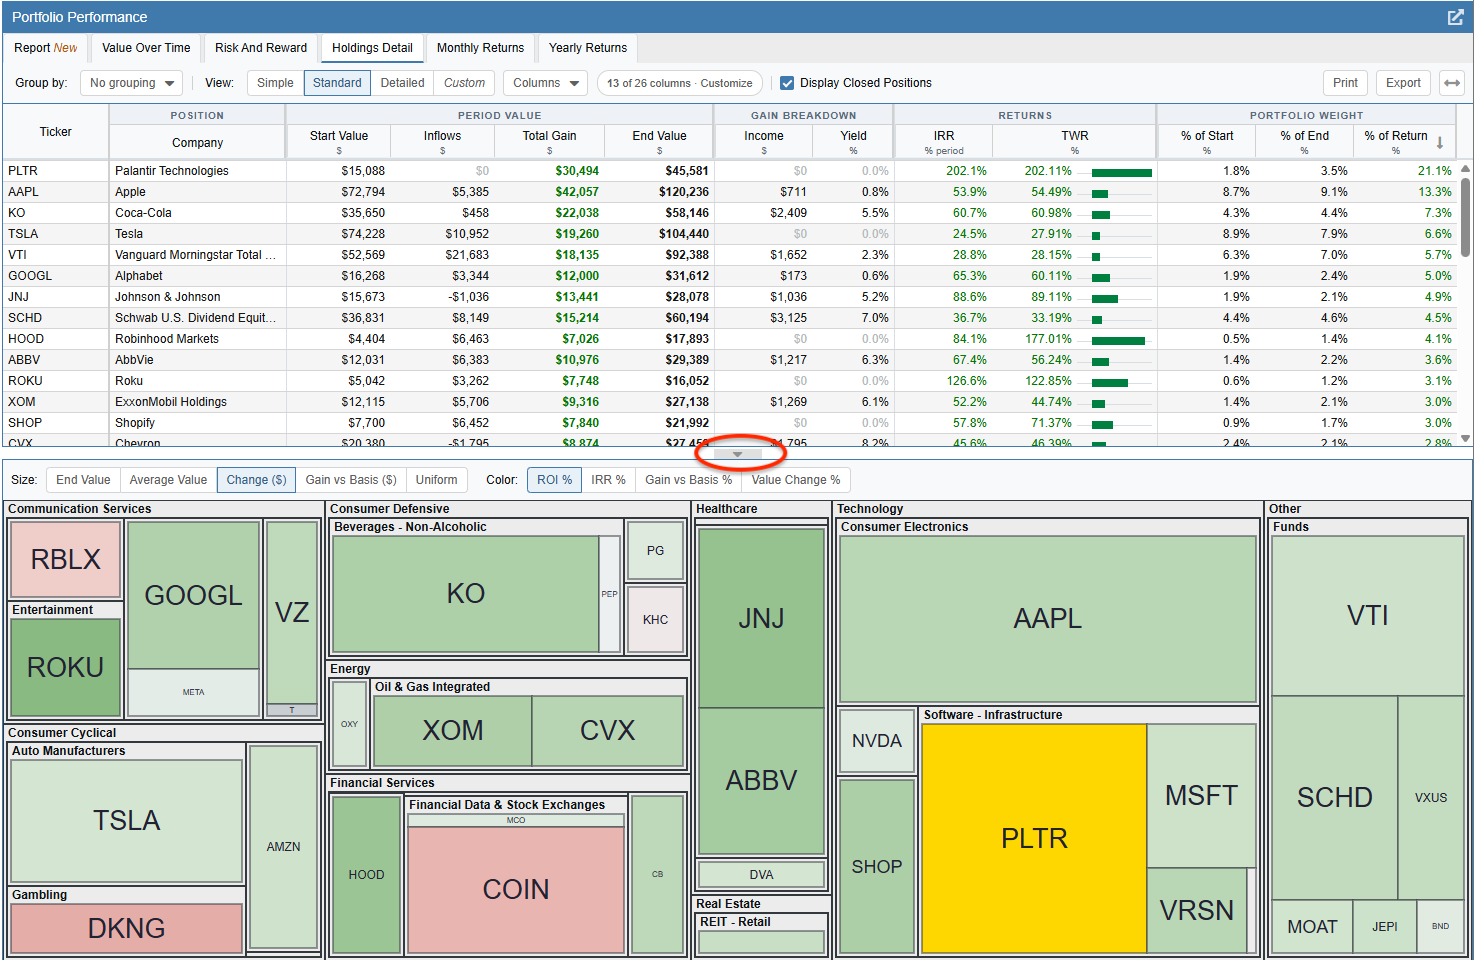
The Holdings Detail tab breaks down the return contribution of every holding you held during the selected period. This ensures that the performance of closed positions is fully represented alongside your existing ones.
This tab features a highly configurable performance table at the top and an interactive Holdings Map at the bottom.
The portfolios you wish to analyze are selected on the left, and the timeframe is configured at the top.
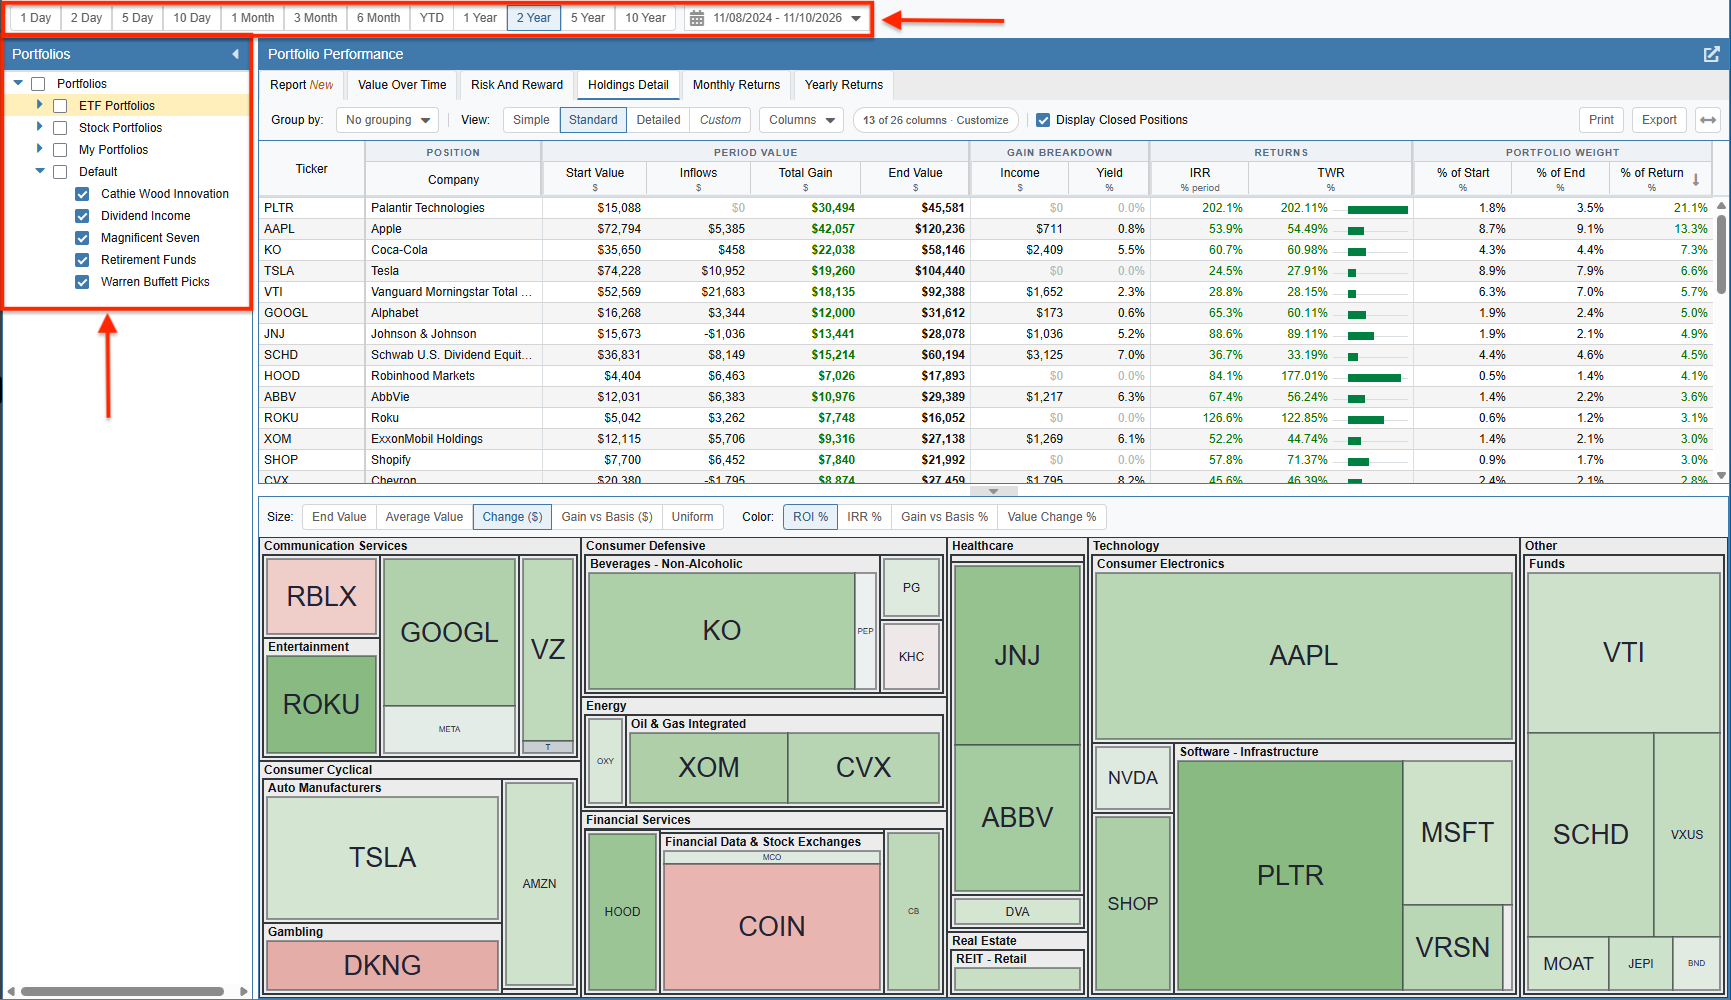
Table Views & Customization
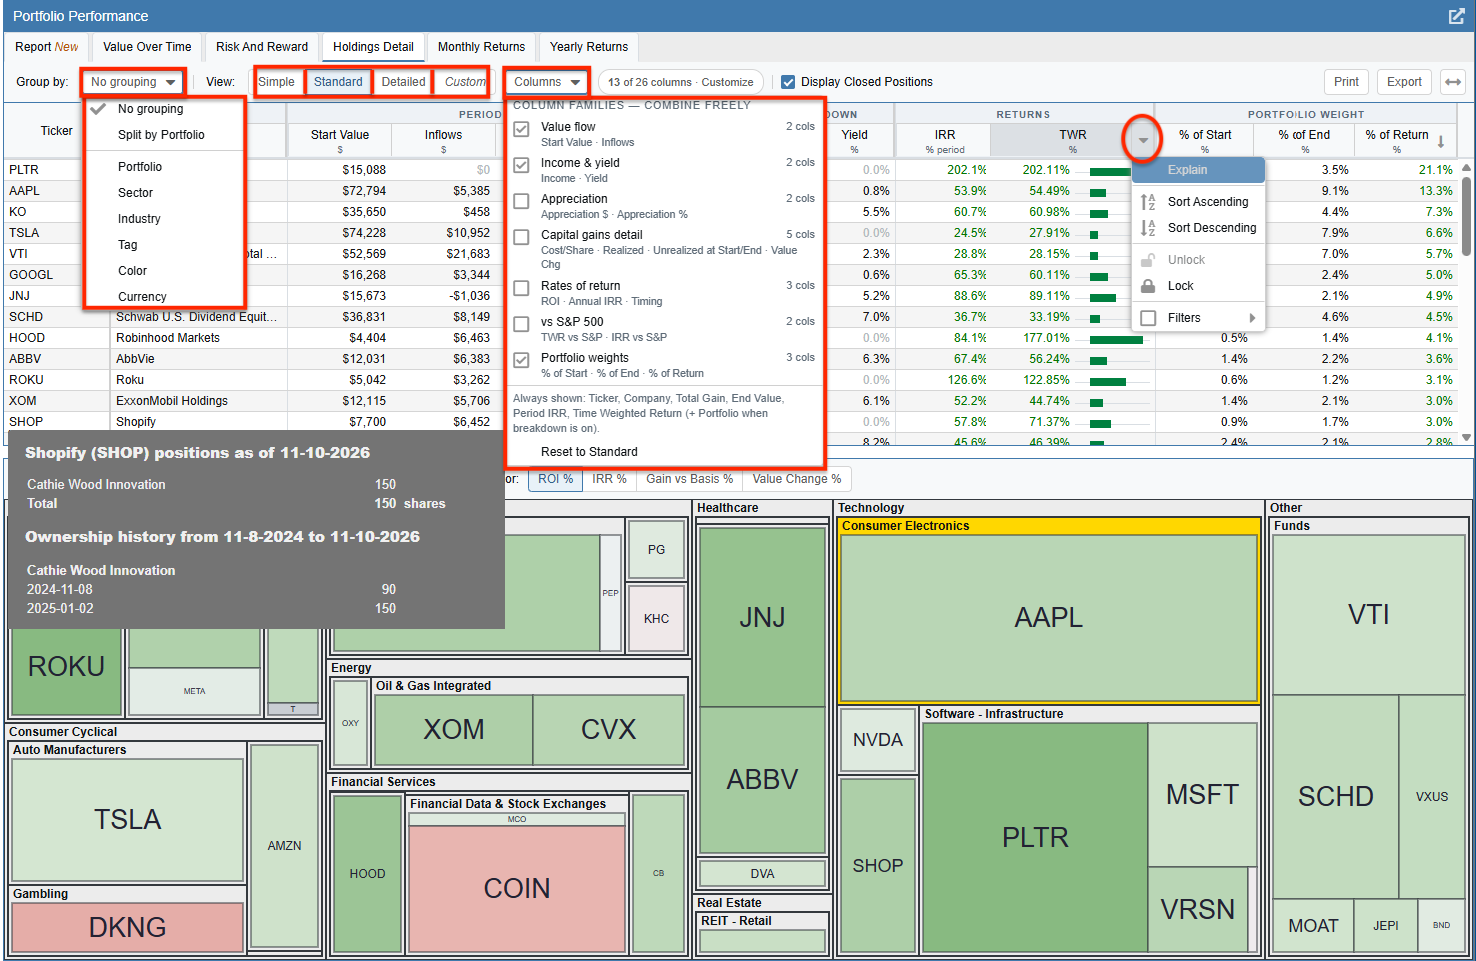
The Holdings Detail table provides an extensive array of metrics to analyze your positions. To make this data manageable, Stock Rover offers three distinct layout presets (Simple, Standard, and Detailed), plus a Custom view.
- Simple: Strips the table down to core performance metrics like total gain and period returns.
- Standard: The default layout, which expands upon the Simple view by including initial values, inflows, income, yield, and portfolio weighting.
- Detailed: Provides the most comprehensive breakdown, specifically detailing capital gains (realized vs unrealized) and comparing returns against the S&P 500.
You can use the Group by dropdown menu to organize the table rows by attributes like Portfolio, Sector, Industry, Tag, Color, or Currency.
You can also create a Custom view by using the Columns dropdown menu. This menu allows you to freely toggle entire column families on or off (such as Value flow, Income & yield, Appreciation, Capital gains detail, Rates of return, vs S&P 500, and Portfolio weights).
Hovering your mouse over a ticker in the table will display a tooltip detailing your current position size and your complete ownership history for that specific asset during the selected timeframe.
Just like in the other tabs, you can right-click any column header to access the Explain option for a detailed metric definition.
Holdings Map
The bottom panel features an interactive heatmap that visually groups your holdings by Sector and Industry.
You can customize the map using the controls at the top of the panel:
- Size: Controls the relative size of each ticker tile (options include End Value, Average Value, Change ($), Gain vs Basis ($), or Uniform).
- Color: Controls the shading of the tiles (options include ROI %, IRR %, Gain vs Basis %, or Value Change %).
Hovering your mouse over any specific ticker tile will trigger a detailed tooltip summarizing that asset’s performance, value, and basis for the selected period.
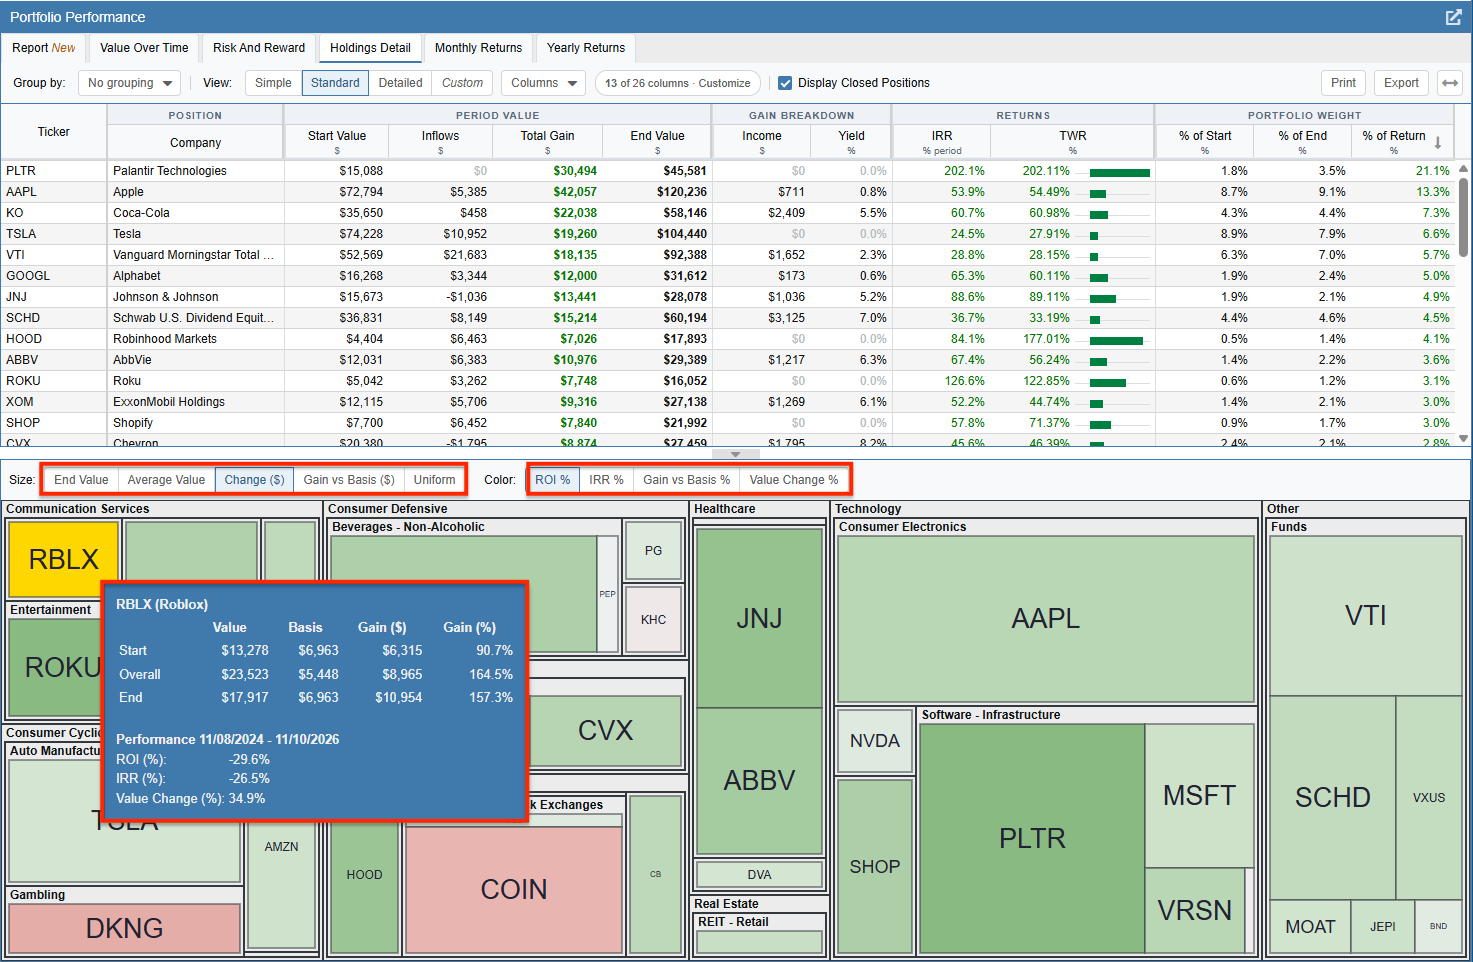
If you prefer to maximize your screen space for the table, you can click the grey toggle arrow located between the table and the map to collapse the Holdings Map entirely.