Yearly Returns
Overview
The Yearly Returns section provides a high-level view of your portfolios’ annual performance, allowing for easy year-over-year comparisons.
The portfolios you wish to analyze are selected on the left, and the reporting timeframe is configured at the top.
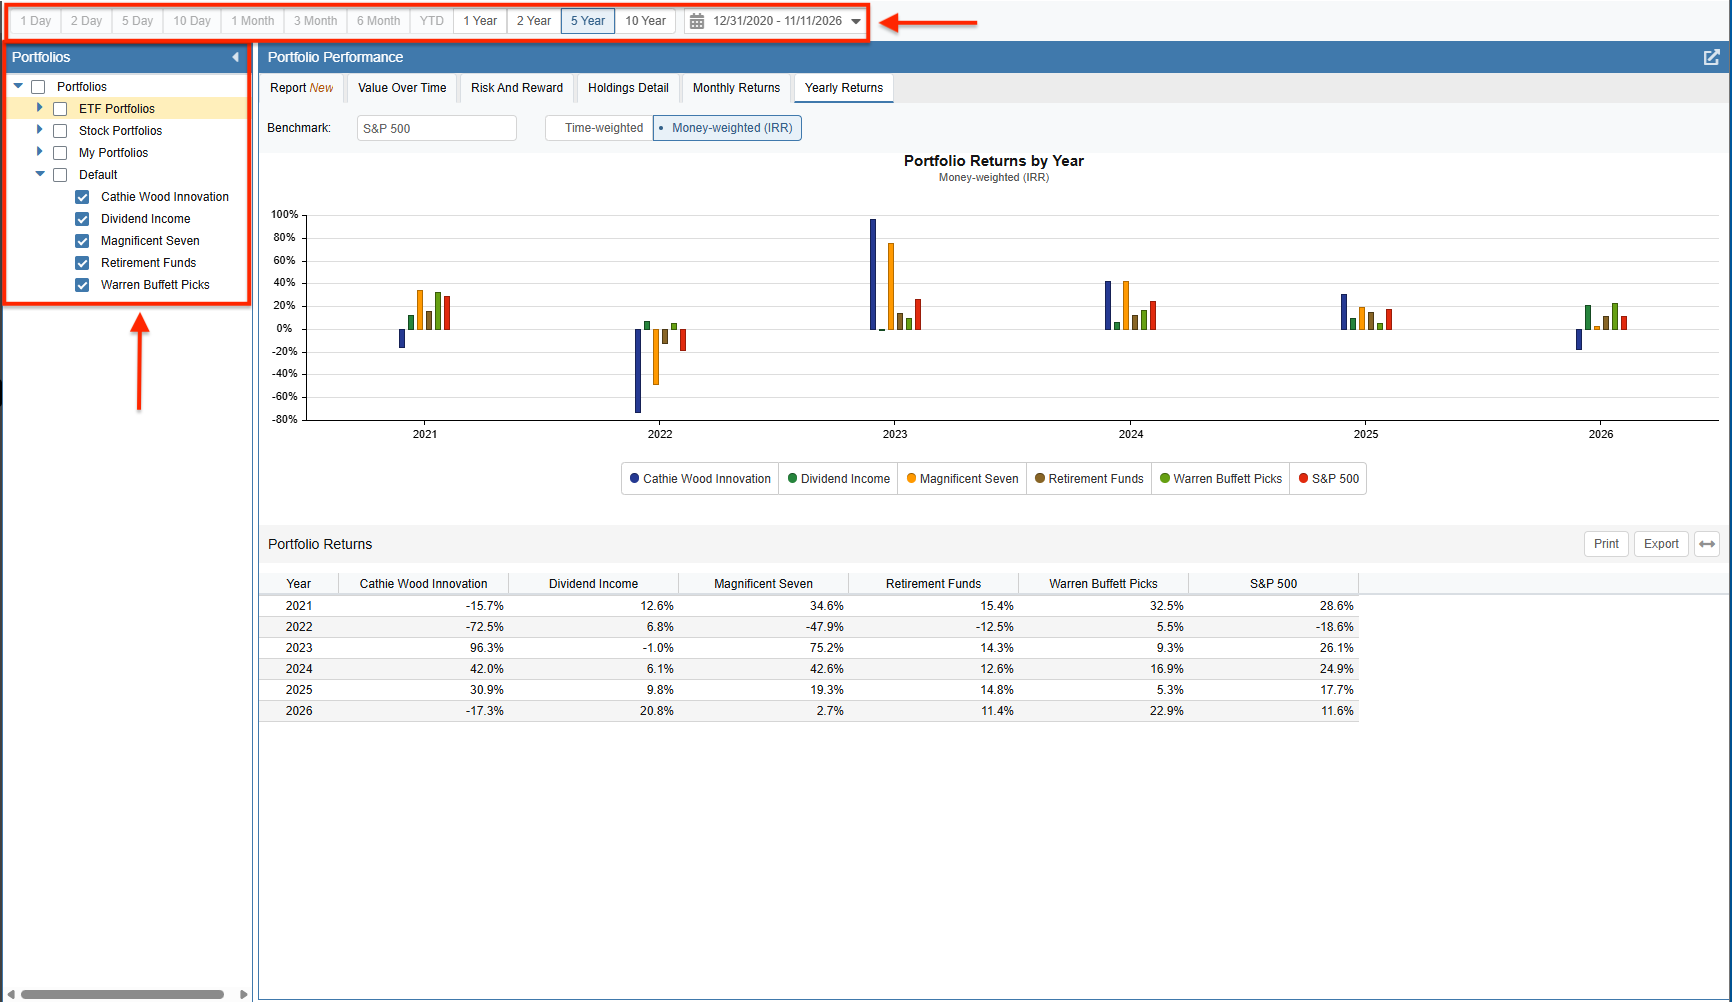
Chart and Table
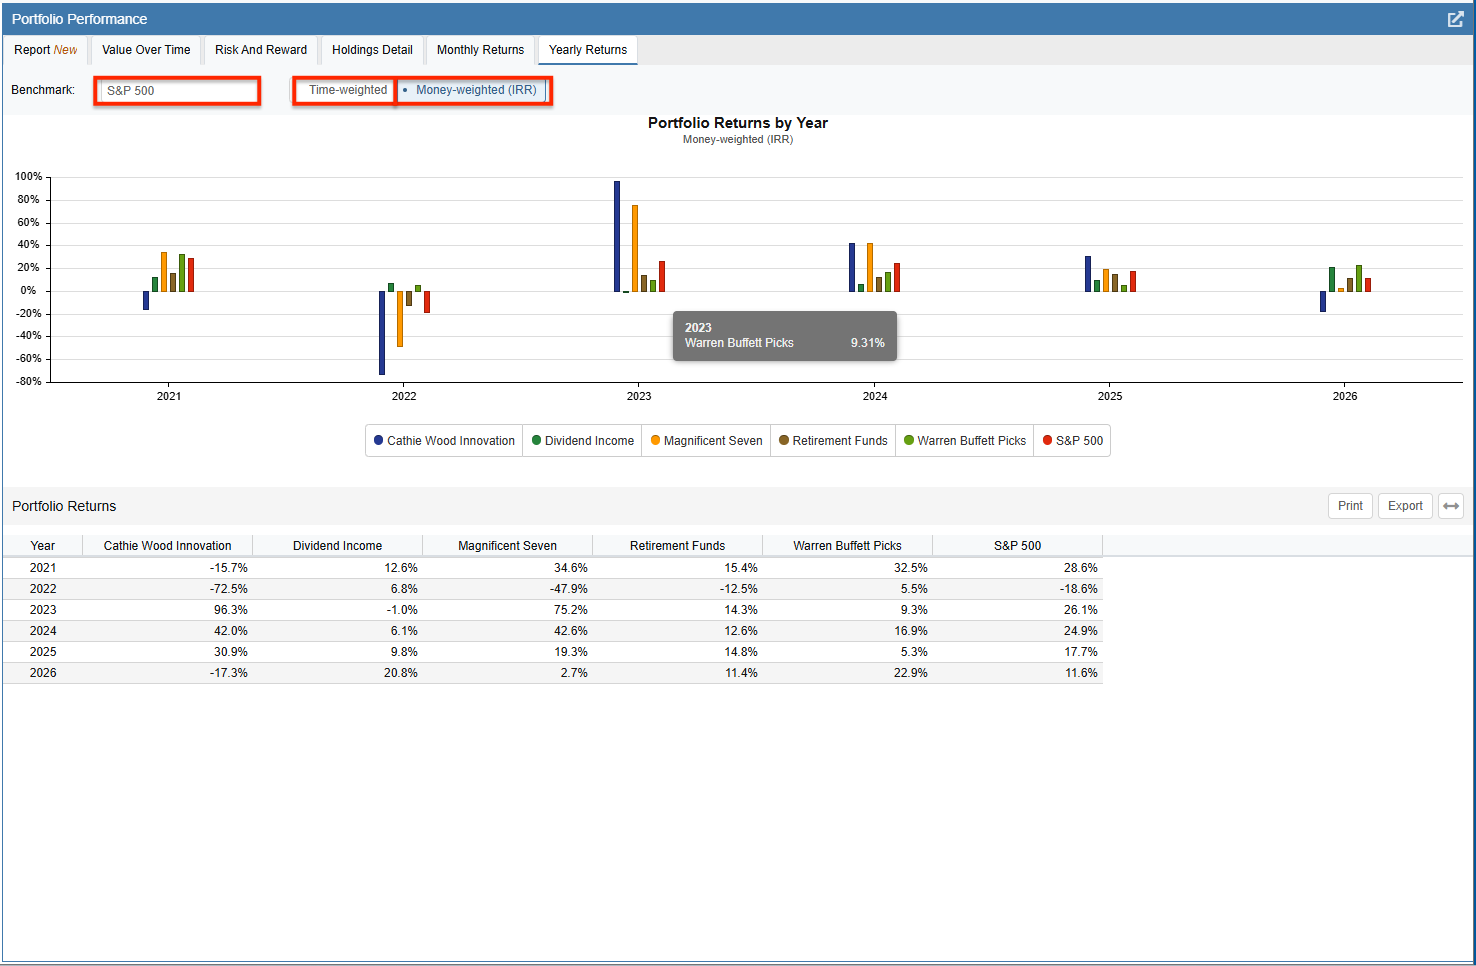
The bar chart allows you to compare portfolio performance within specific years and quickly identify which portfolios outperformed or underperformed your expectations.
You can customize the chart using the controls at the top left:
- Benchmark: Select a market index (like the S&P 500) to plot alongside your portfolios for a direct visual comparison.
- Return Methodology: Select between Time-weighted returns (measuring pure asset performance) or Money-weighted (IRR) returns (factoring in the timing of your personal cash flows).
When you hover over any bar in the chart, a tooltip appears displaying detailed information, including the specific year, the name of the portfolio or benchmark, and the exact percentage return.
Below the chart is the Portfolio Returns table. Each row displays a specific year, with sortable columns detailing the exact return for every selected portfolio alongside the chosen benchmark’s return.