
Report
Introduction
The Performance Report acts as an executive summary for your investments. This vertically scrolling report pulls together vital metrics into a cohesive view. You can run the report on an individual portfolio or aggregate multiple portfolios to assess your total net worth, and you can download the entire report as a PDF using the button at the top.
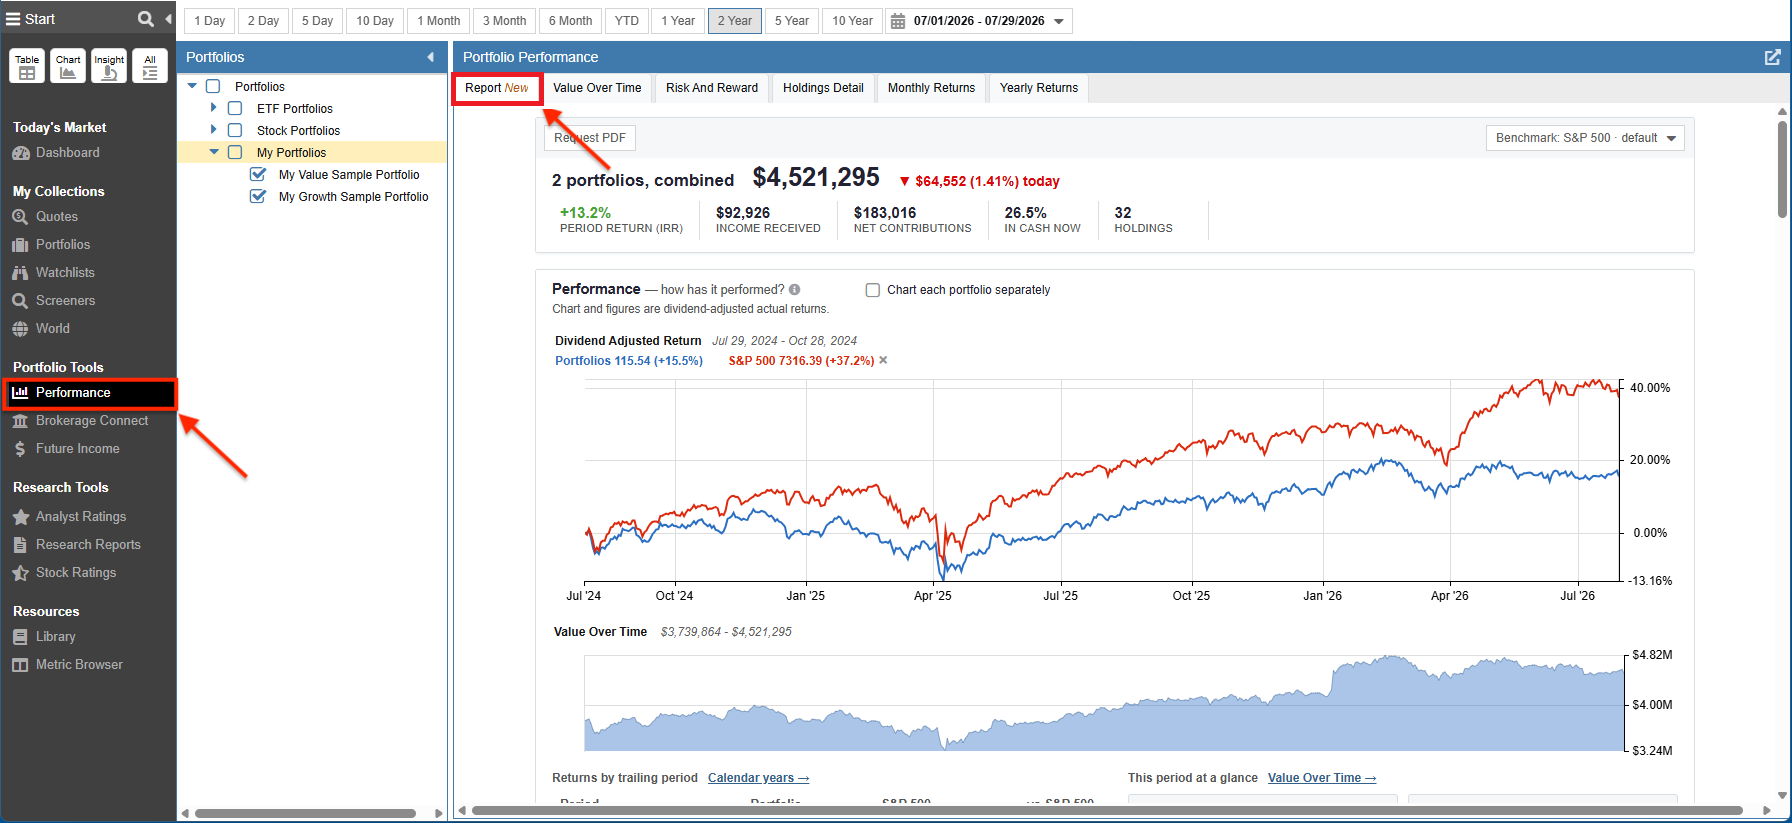
You can access the Performance Report by clicking on Performance under Portfolio Tools in the Start Menu, and then selecting the Report tab.
The portfolios you wish to report on are selected on the left, and the timeframe is selected at the top.
At-A-Glance Summary
At the very top of the report, a summary banner provides an immediate read on your portfolio’s health. It highlights your total combined portfolio value, today’s dollar and percentage change, your period return (IRR), total income received, net contributions, current cash allocation, and your total number of holdings.

Performance — how has it performed?
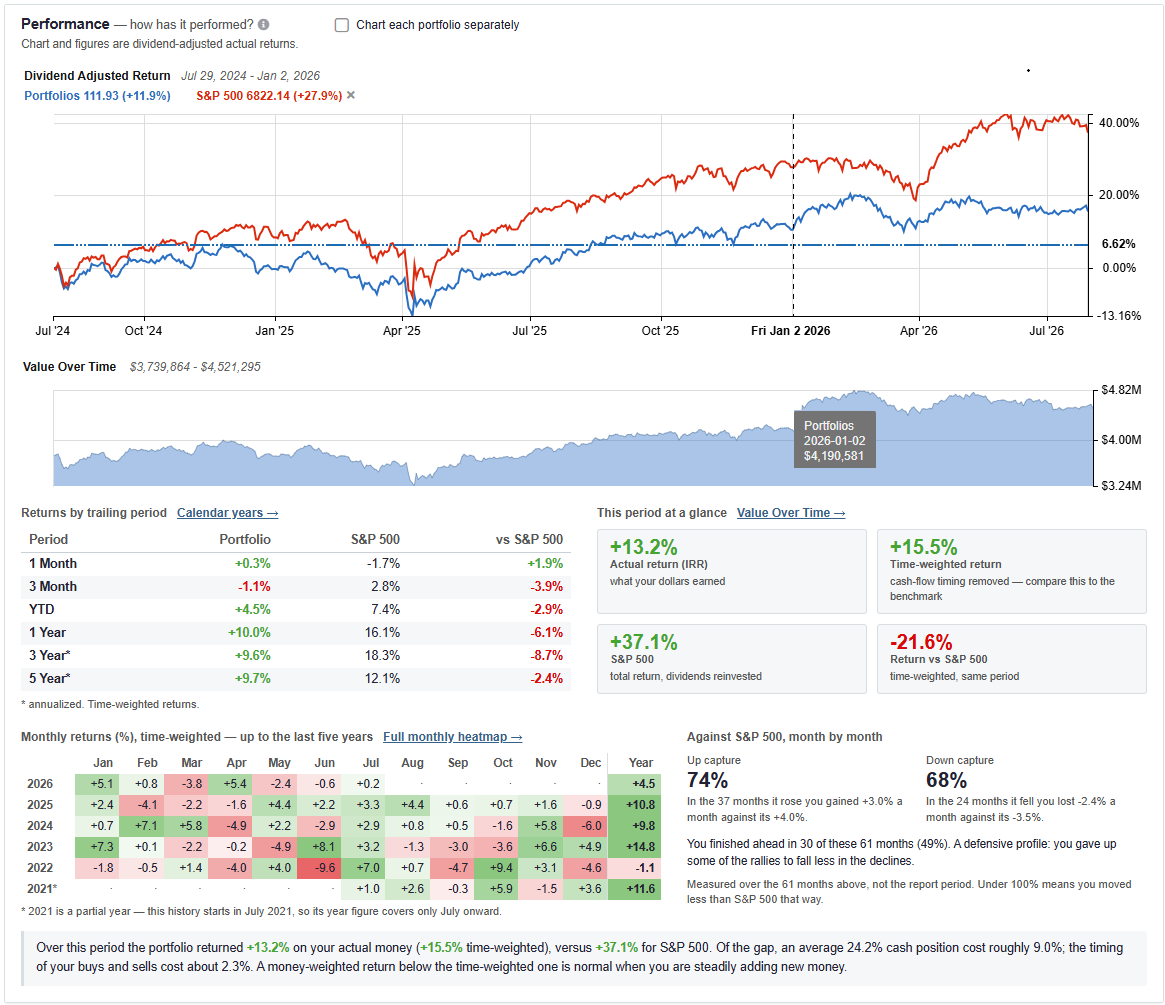
The main Performance section plots your dividend-adjusted actual returns against your selected benchmark over time. You can choose to chart portfolios combined or separately.
Directly below the price chart, a shaded area chart displays your total Value Over Time. A summary table provides a breakdown of returns by trailing periods (1 Month, 3 Month, YTD, 1 Year, 3 Year, 5 Year) against your benchmark. It also highlights key summary metrics for the period, including Actual Return (IRR) and Time-Weighted Return.
What changed your balance
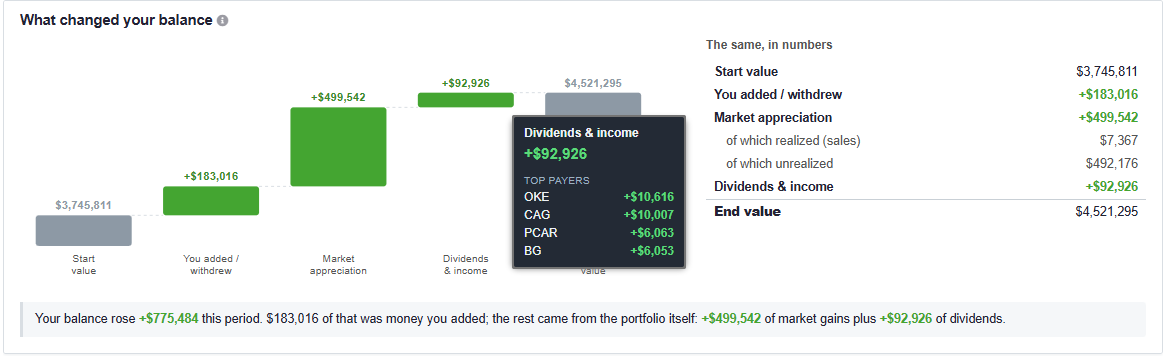
The What changed your balance section features a visual waterfall chart. This chart decomposes the changes in your balance into three distinct drivers: net capital added or withdrawn, market appreciation, and accrued dividends and income. An accompanying table on the right breaks down the market appreciation figure further into realized (sales) and unrealized gains.
Your return, two ways
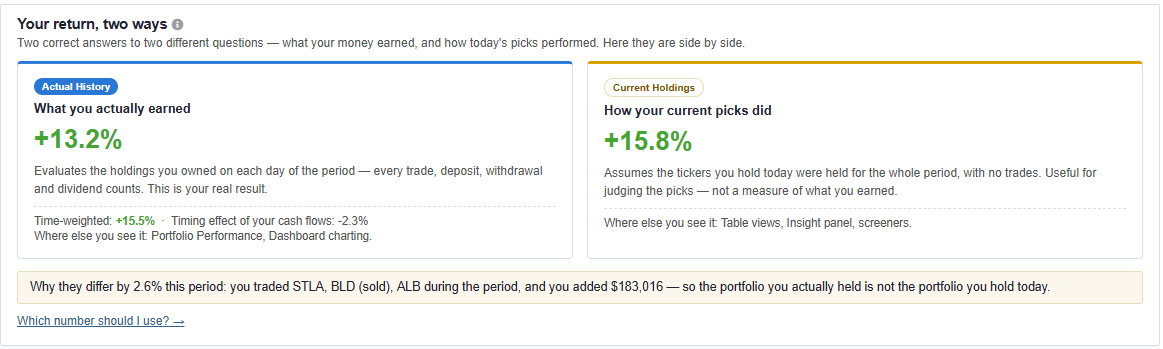
This section provides a side-by-side comparison of two different performance methodologies:
- Actual History: Evaluates the holdings you owned on each day of the period, accounting for every trade, deposit, withdrawal, and dividend. This reflects what you actually earned.
- Current Holdings: Assumes the tickers you hold today were held statically for the entire period, with no trades. This is useful for judging the performance of your current picks.
What drove it — contributors & detractors
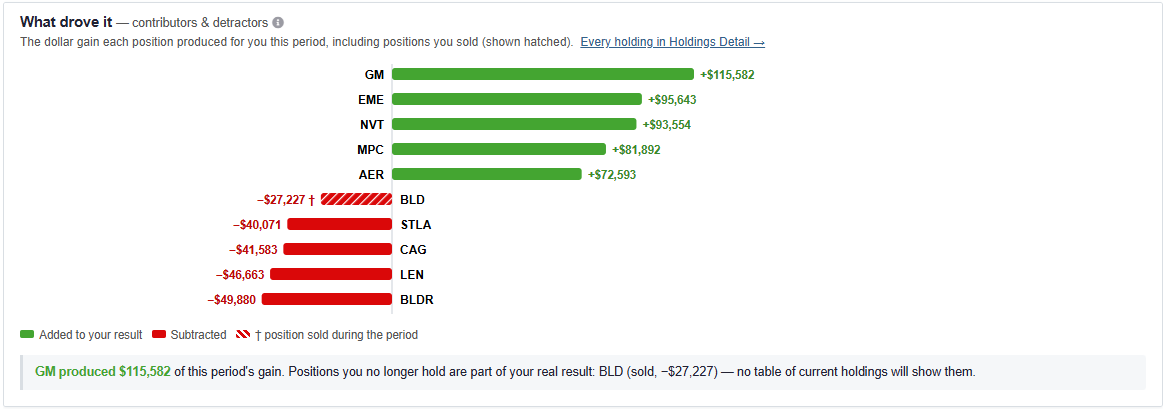
The What drove it section uses a horizontal bar chart to identify the exact dollar gain or drag each individual asset contributed over the period. This includes positions you sold during the period, which are marked with a hatched pattern.
Income — what does it pay?
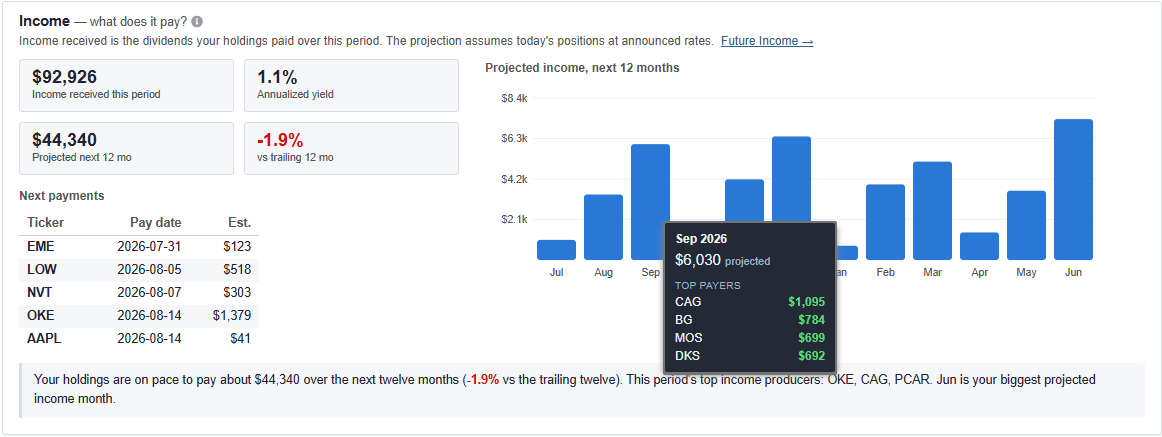
The Income section details the dividends your holdings paid over the period alongside an annualized yield calculation. It also features a forward-looking bar chart that models your projected income over the next 12 months based on announced payout rates. You can hover over the projected bars to see the top paying equities for a specific future month.
Composition — what do you own?
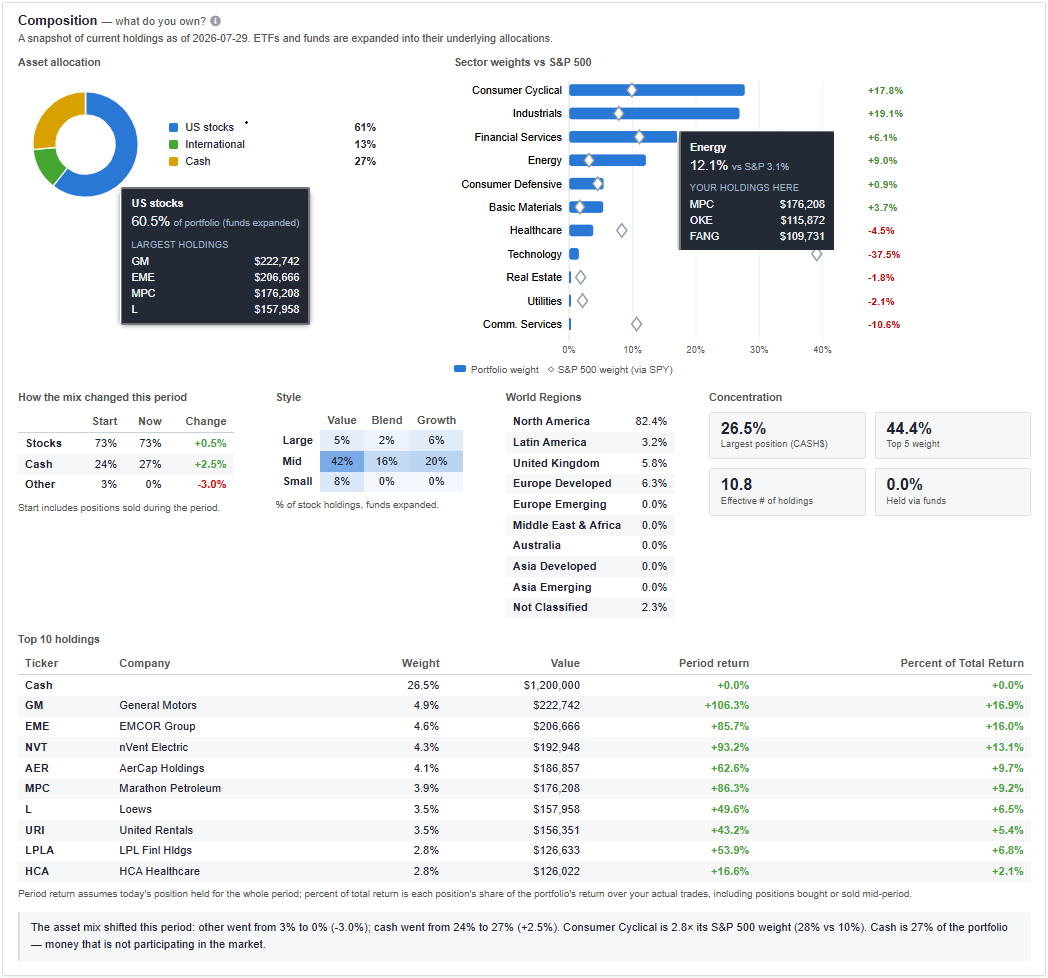
The Composition section provides a snapshot of your current holdings. It expands ETFs and funds into their underlying allocations. Key visuals include:
- An Asset Allocation donut chart (Stocks vs International vs Cash).
- A Sector weights comparison against the S&P 500.
- An equity Style box (Value/Blend/Growth across Large/Mid/Small cap).
- A World Regions breakdown.
- Concentration metrics, including top 5 weight and effective number of holdings.
Risk — how much risk are you taking?
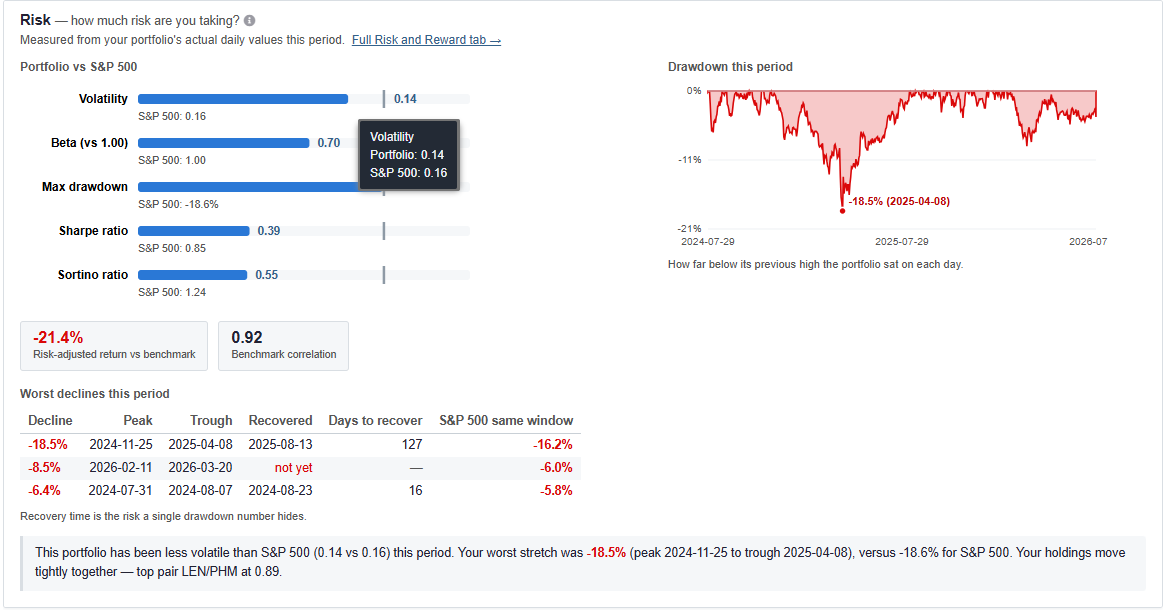
The Risk section benchmarks your portfolios against the broader market using quantitative metrics including Volatility, Beta, Max drawdown, Sharpe ratio, and Sortino ratio. It includes a daily drawdown chart and a table outlining your worst declines and recovery times during the period.
Checkup — what deserves attention
The Checkup section flags areas of your portfolio that may require attention. It automatically surfaces warnings based on the data, such as sector concentration or uninvested cash drag during a positive period. Each flag includes a link to the specific Stock Rover tool that can address the issue (like Rebalancing or Value Over Time).
