Fund Reports

Introducing Fund Reports — comprehensive, multi-page research reports for 7,400 ETFs and 20,000 mutual funds. Holdings, performance, risk, cost, and income, pulled together into a single print-ready document with plain-English commentary and automatic red-flag detection.

One click in Stock Rover produces a polished fund tearsheet: data-rich, easy to scan, and annotated with plain-English commentary. The report adapts to what you’re researching — equity funds get sector, style, and region breakdowns; bond funds get duration, credit quality, and yield-to-maturity. View reports right in the app or export them to PDF to save and share.
Fund Reports are included with Stock Rover Ultimate, and every plan can explore reports for a sample set of representative funds. Read the launch announcement for everything new in the July update.
Know whether a fund deserves your attention the moment you open the report.

Reports are generated on demand using the latest market and financial data, so your research is never outdated.
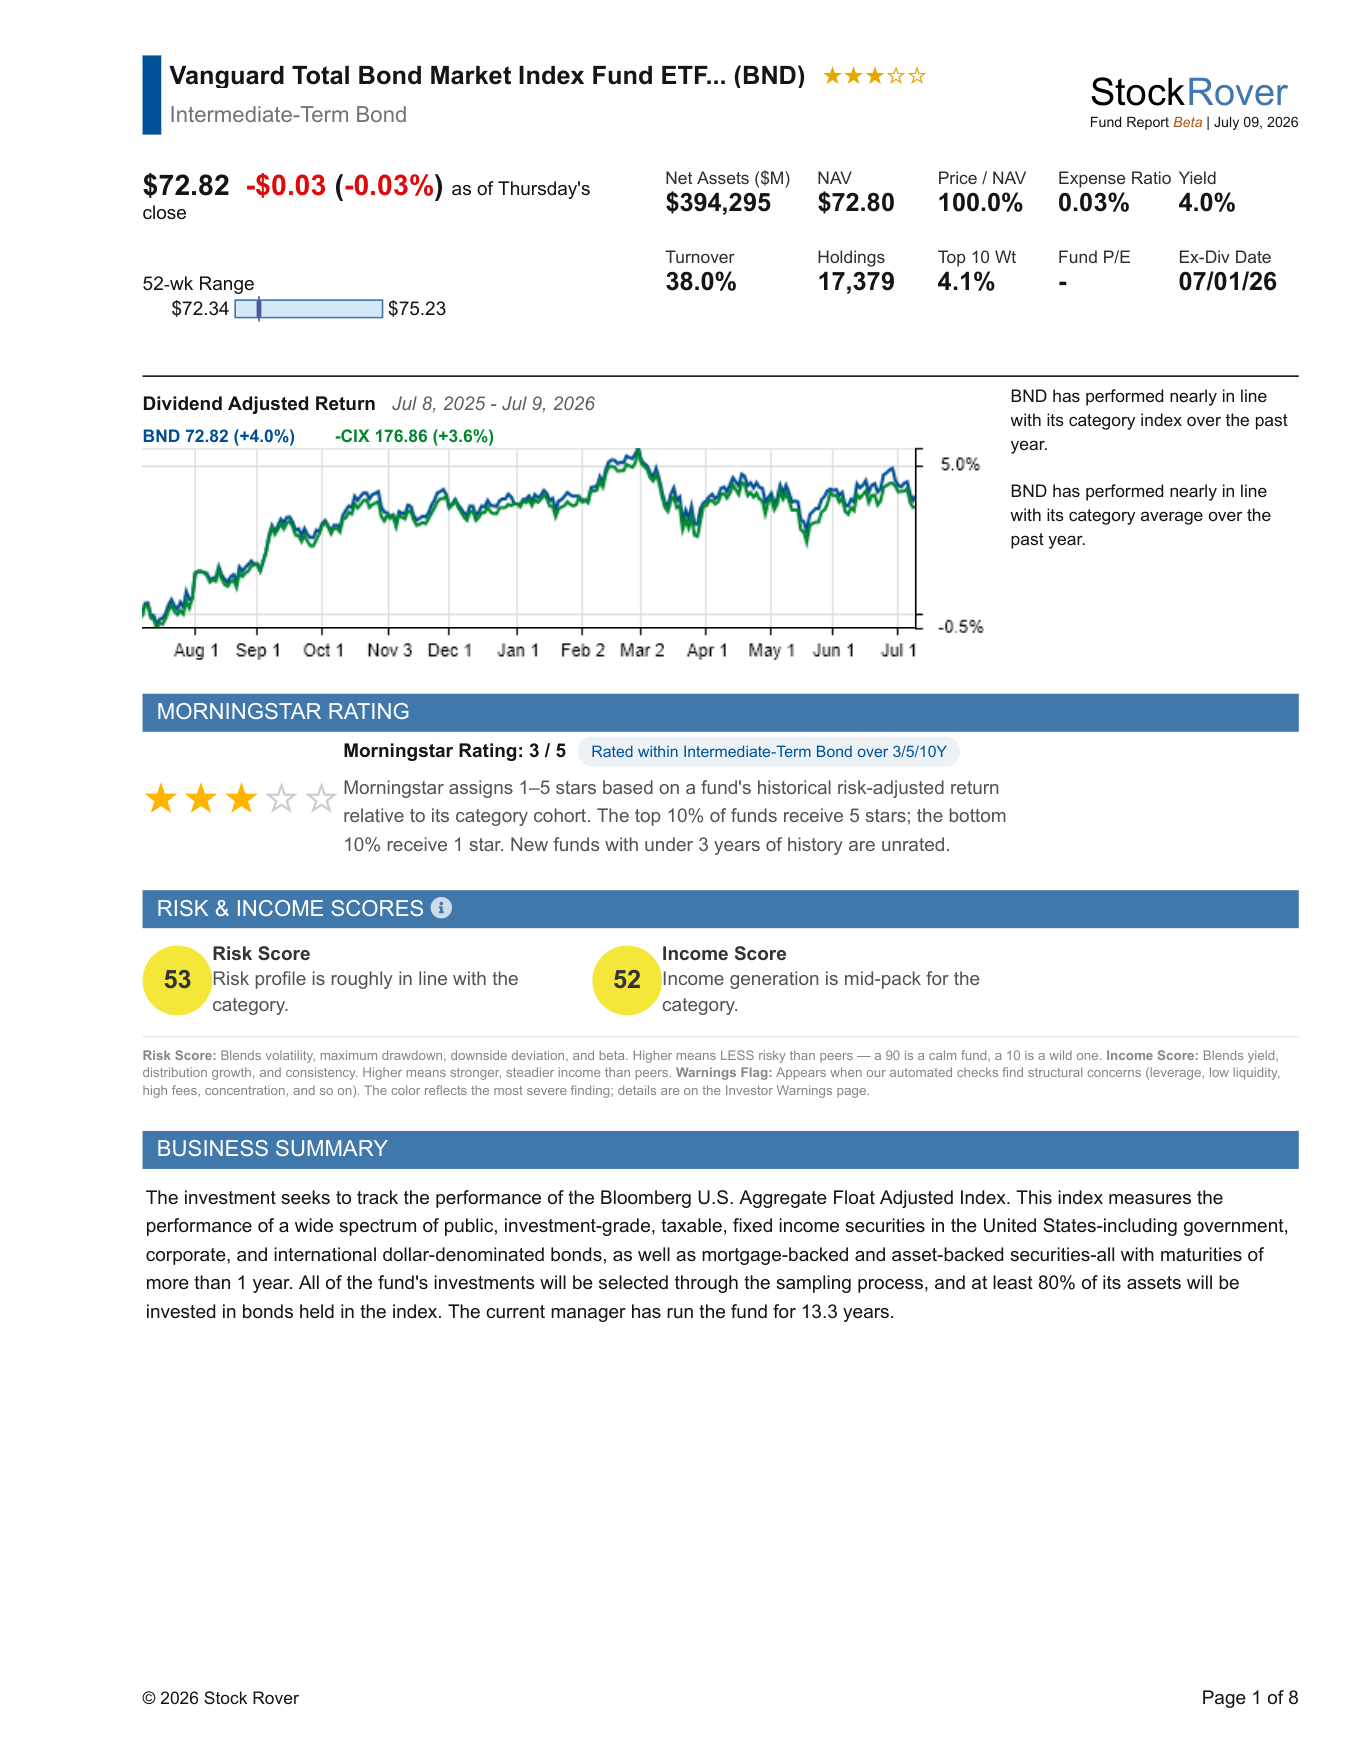
Page one shows the fund’s Morningstar Rating alongside Stock Rover’s Risk and Income Scores — percentile ranks within its peer cohort — plus price, yield, expense ratio, and a plain-English summary of what the fund actually holds and does.
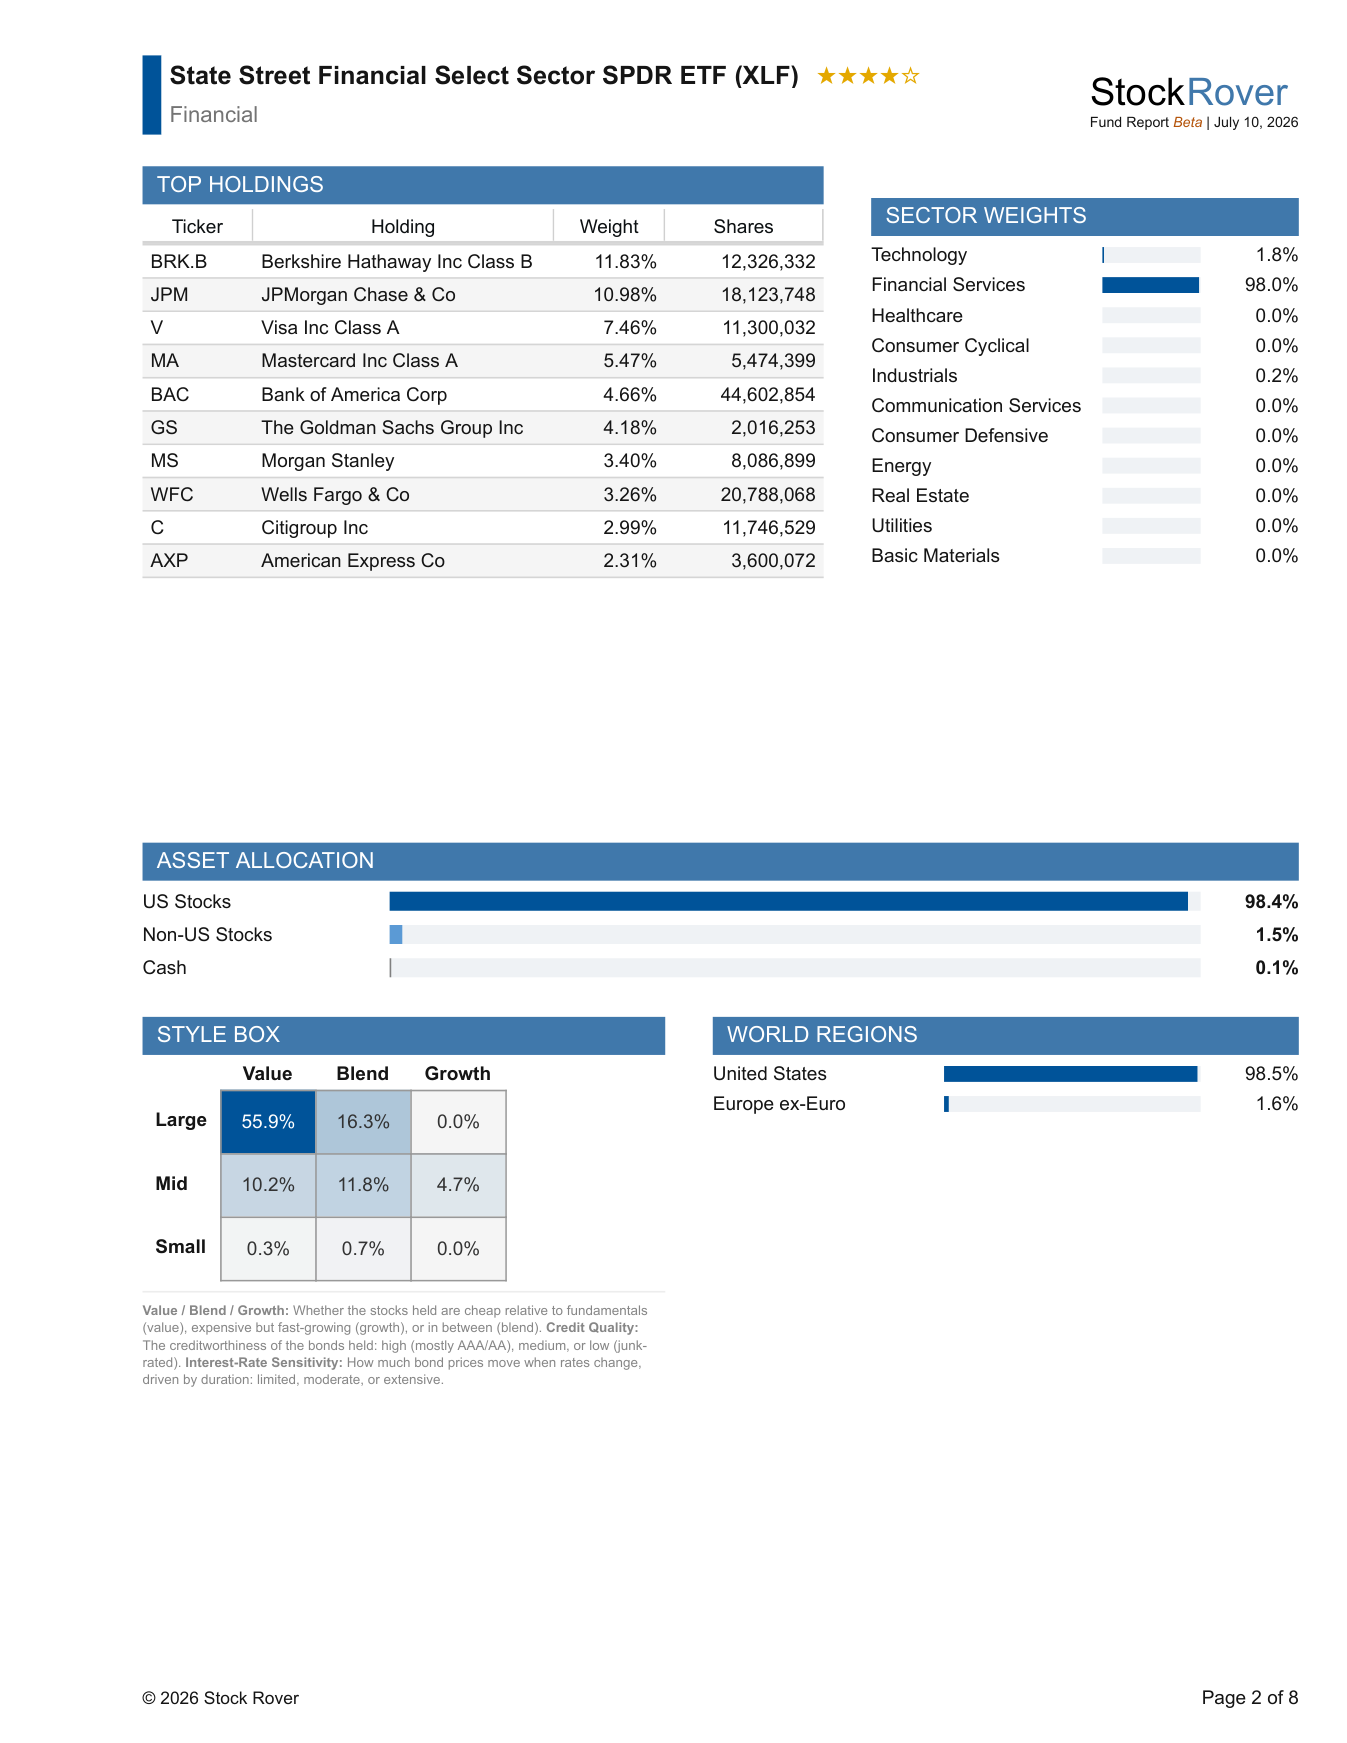
The report adapts to the fund type, so every section speaks the right language.
Top holdings, sector weights, world regions, asset allocation, and the classic value–growth × size style box.
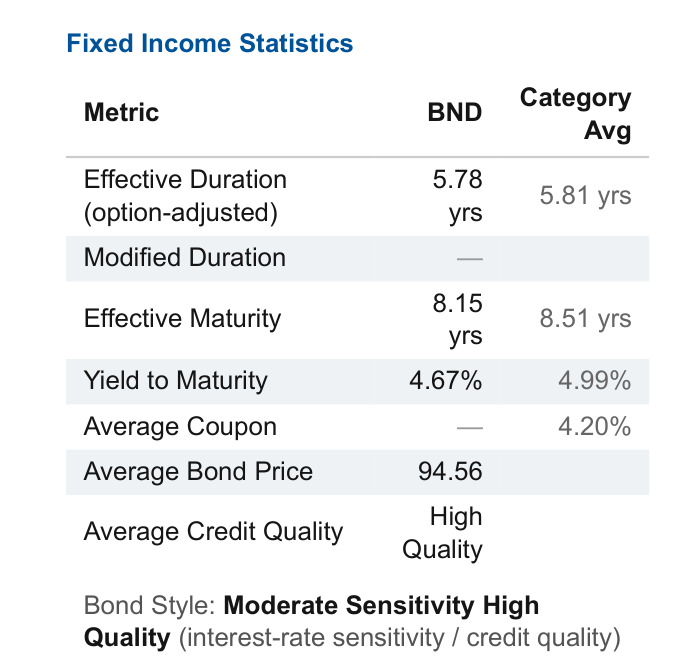
Fixed-income statistics — effective duration, effective maturity, yield to maturity, average coupon, and credit quality — plus a bond style box gridding credit quality against interest-rate sensitivity.
Equity and fixed-income sections combine, so multi-asset funds get the full picture on both sides of the portfolio.
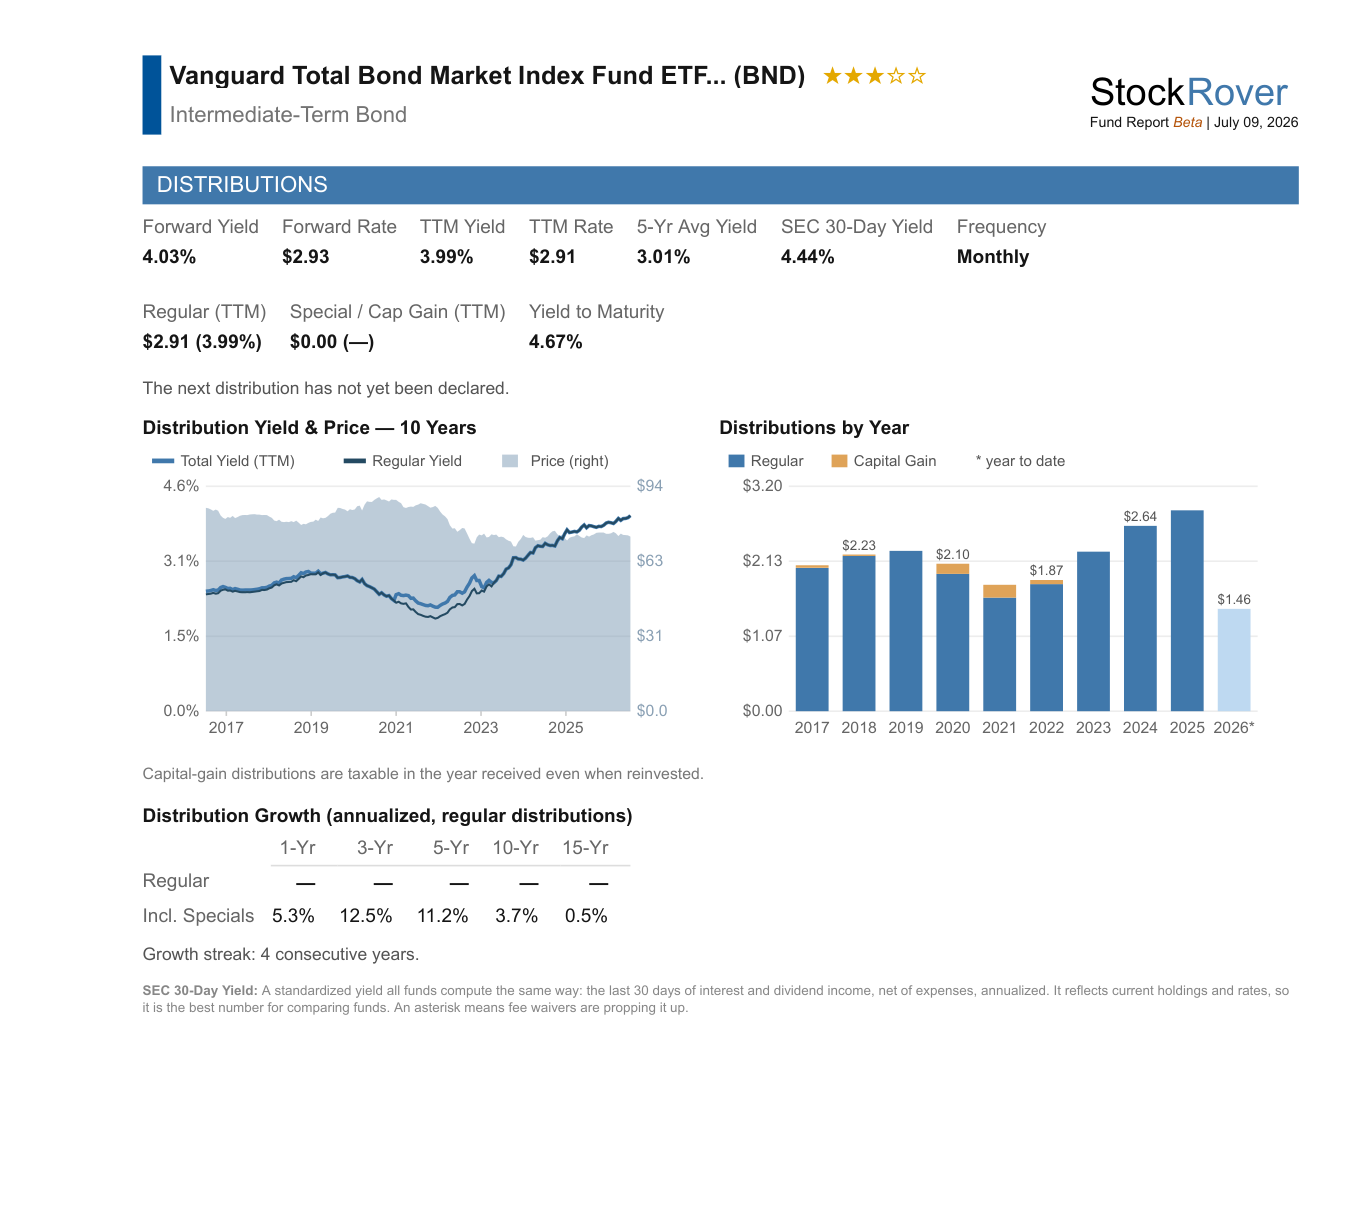
The Distributions section is the deepest fund income analysis you’ll find outside a spreadsheet.
Forward yield and rate side by side with TTM yield, 5-year average yield, SEC 30-day yield, and payout frequency — see where the payout is heading, not just where it’s been.
Steady regular distributions are separated from lumpy specials and capital-gain payouts, so a fund’s real recurring income is clear — critical for option-income and managed-distribution funds.
An annualized distribution growth ladder spans 1 to 20 years, with growth streaks and auto-written commentary. When a fund’s payout truly varies, the report says so plainly instead of showing a misleading growth number.
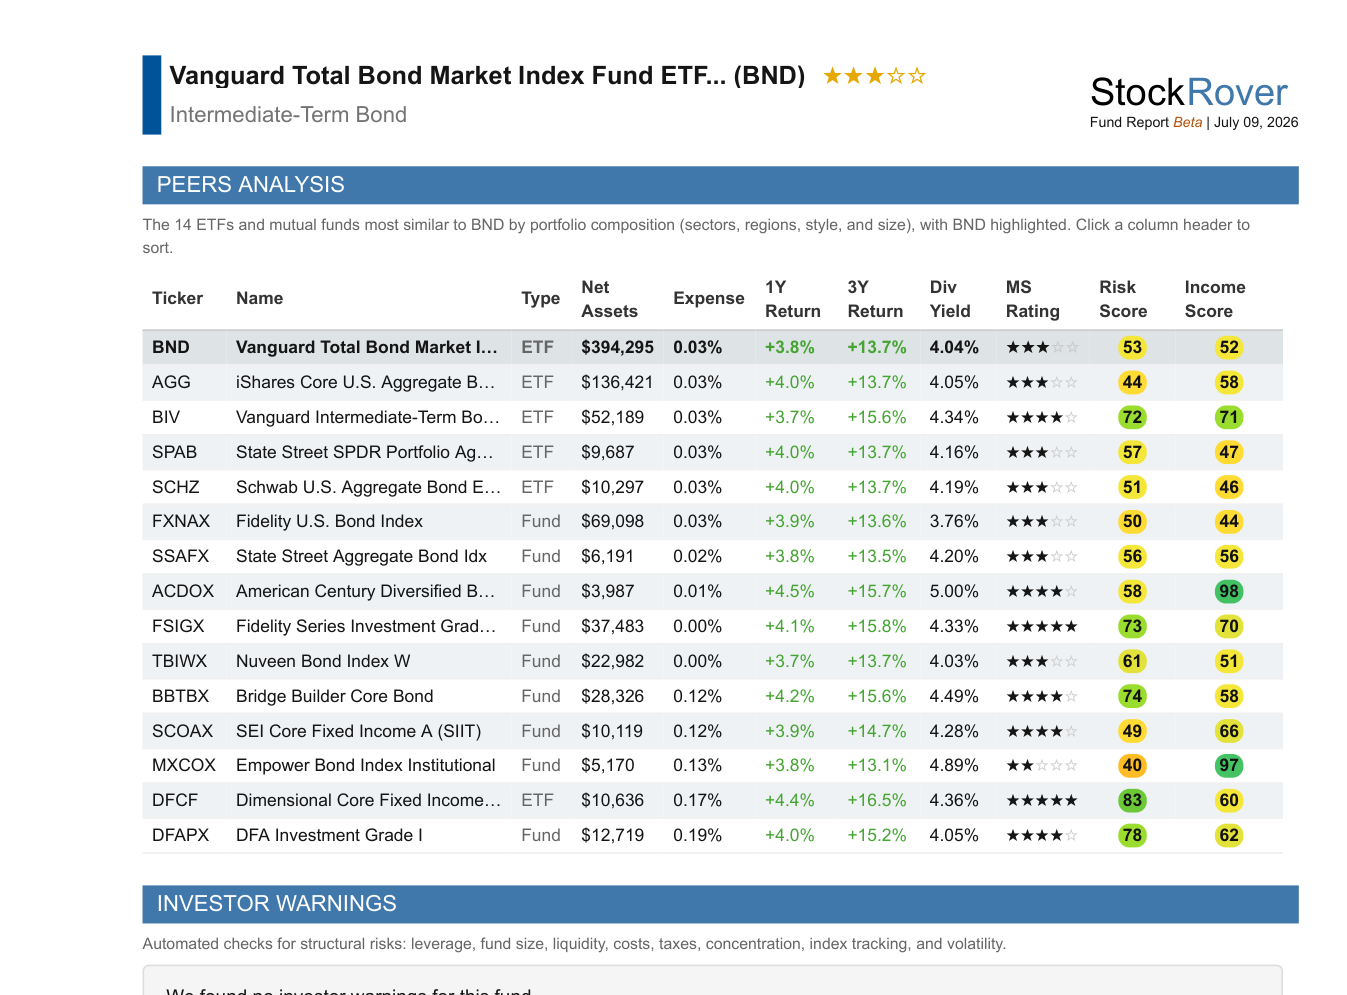
A fund rarely exists in isolation. The best pick is often the best fund in the category.
Every report compares the fund against the 14 ETFs and mutual funds most similar by portfolio composition — sectors, regions, style, and size — with expenses, returns, yield, ratings, and scores side by side.
The report identifies the index the fund actually tracks most closely — not just its stated benchmark — and grades tracking quality, R-squared, and alpha against it.
Nine automated checks scan every fund for structural risks — each graded by severity and explained in plain English.
Leveraged and inverse funds are flagged with their reset frequency, tiny funds carry closure and liquidity risk, and low trading volume means wider spreads.
High expense ratios, 12b-1 fees, and high tax-cost ratios — the quiet compounders working against your returns.
High tracking error against the fund’s best-fit index, wide or volatile premium/discount to NAV, and concentrated top-10 holdings.
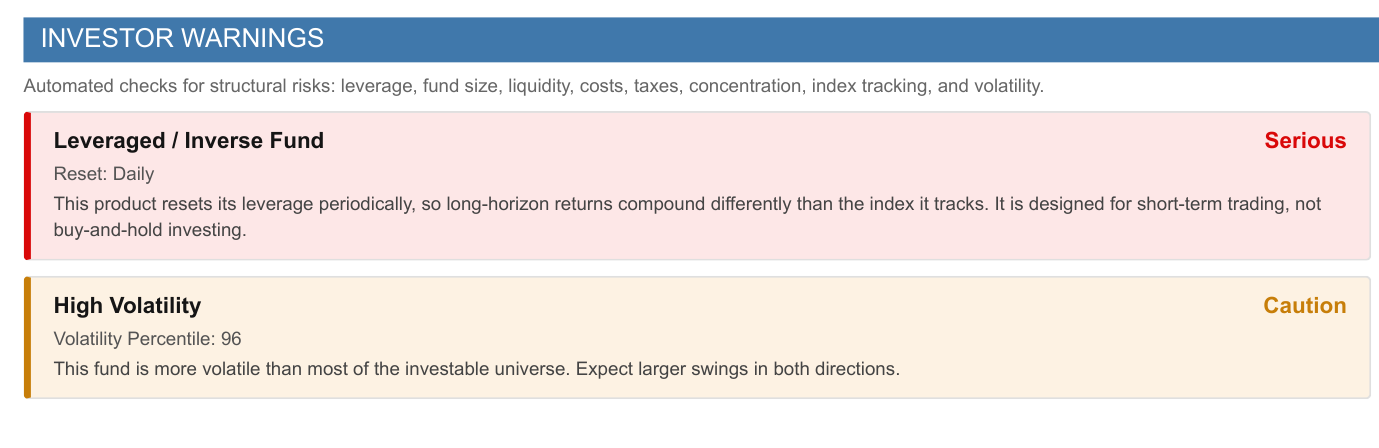
Download a complete sample report and see the depth for yourself. With a Stock Rover Ultimate subscription you can generate reports for any of the 7,400 ETFs and 20,000 mutual funds we cover — all other plans include reports for a sample set of representative funds.