
Phone apps that flash green and red answer a different question than this page is about. Serious tracking is a job with a spec: both return methodologies computed and labeled, dividends recorded and projected, risk measured against a benchmark, fees surfaced in dollars, and all of it across every account you hold. Five tools do parts of that job well; they overlap less than you would guess.
$29–$79/mo billed annually · 14-day card-free trial. Link your brokerages and Stock Rover maintains a daily, dividend-adjusted record across accounts, then reports on it like an institution would report to a client: the Portfolio Performance Report covers IRR and time-weighted return side by side, risk vs the S&P 500, income received and projected by month, fee drag in dollars, and what actually drove the result. Because the tracker lives inside a research platform, the next decision (screening up to 800+ metrics, 20-year fundamentals, fund reports on 7,400 ETFs and 20,000 mutual funds at the Ultimate tier) happens in the same tool.
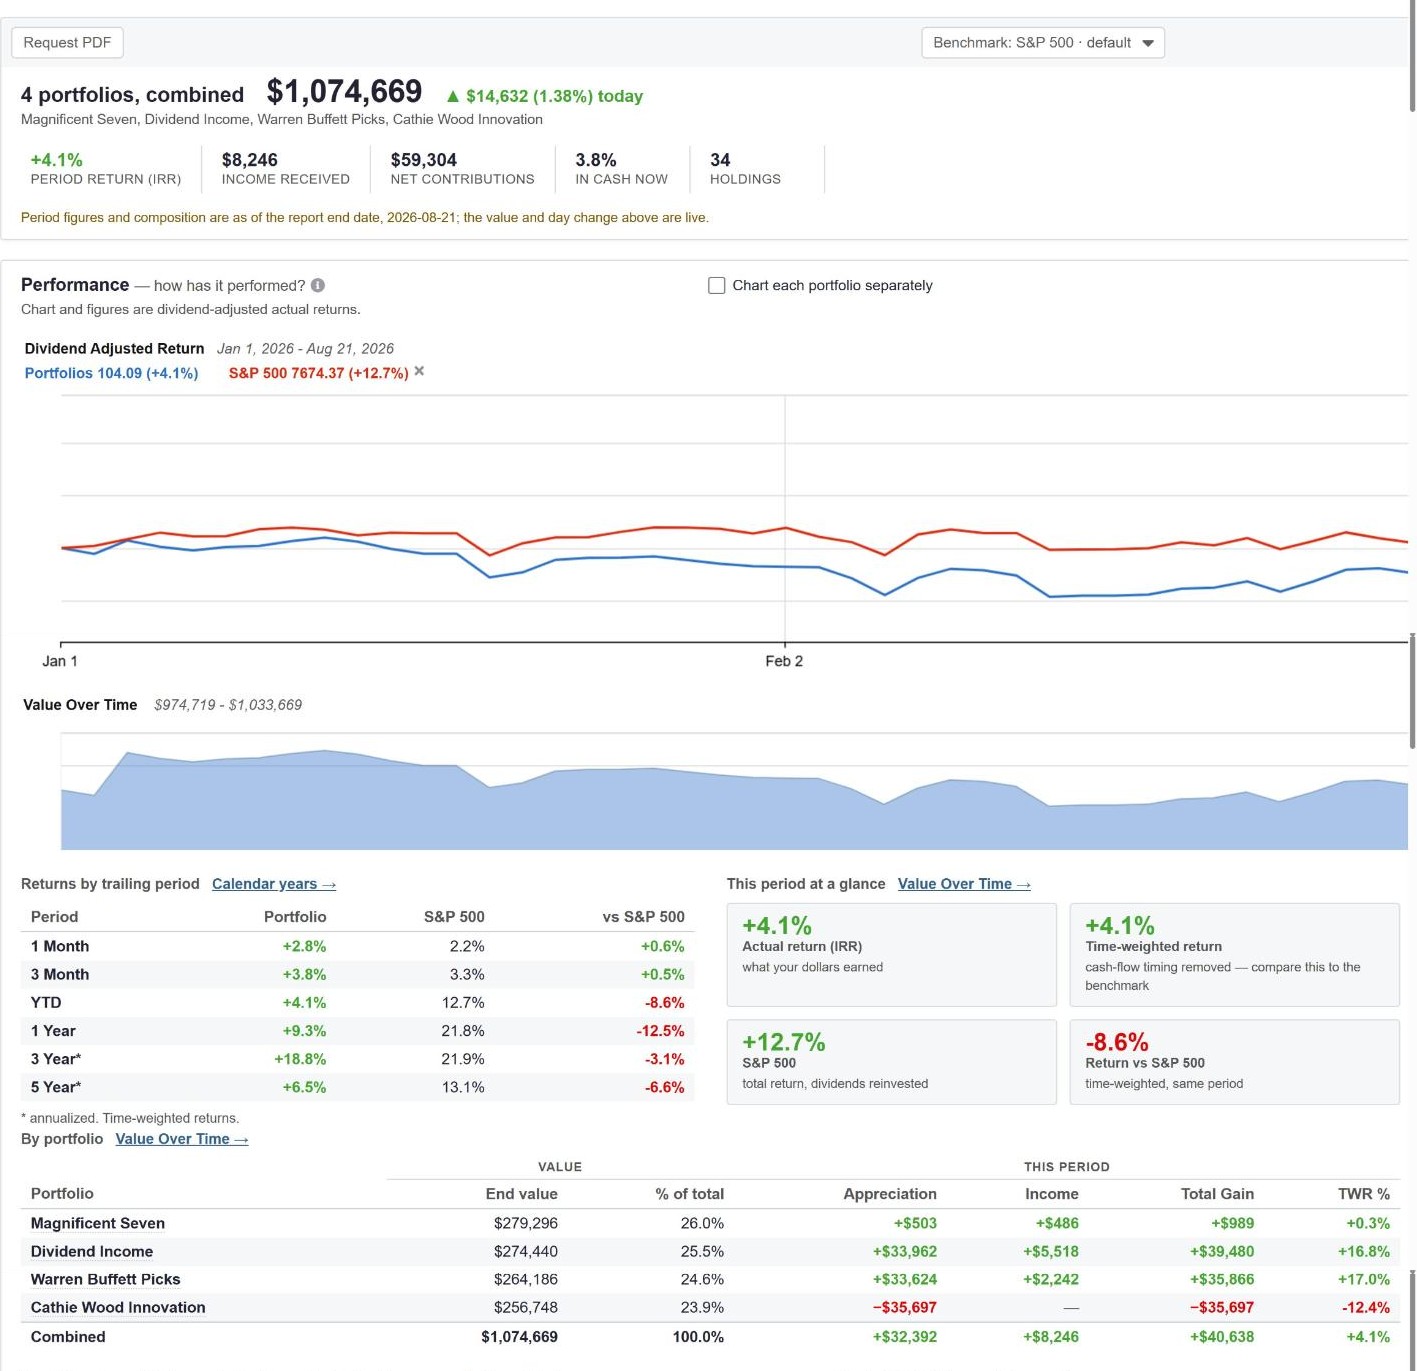
The Portfolio Performance Report on a four-portfolio demo account.
Free (10 holdings); $84–$279/yr. A meticulous investment ledger: automatic dividends and corporate actions, 60+ exchanges, multi-currency returns decomposed into capital, income and FX, plus accountant sharing. For portfolios that span countries, it is the standard.
Free. The household picture: every bank, brokerage, card and 401(k) in one net-worth view, an allocation x-ray, the well-known fund Fee Analyzer, and a Monte Carlo retirement planner. As a free complement to a real tracker, it is excellent.
Free tier; $79.99–$249.99/yr. Income calendars, dividend-growth charts and diversification views that make a dividend portfolio a pleasure to watch, with broad broker aggregation including European accounts.
$250/yr (Black tier for complex multi-entity wealth: $2,500). A personal balance sheet more than a portfolio tracker: global banks and brokers plus crypto, DeFi, real estate, collectibles and LP stakes, with estate-handover features. For complex wealth spread across asset classes, nothing else covers as much.
| Capability | Stock Rover | Sharesight | Empower | Snowball | Kubera |
|---|---|---|---|---|---|
| IRR (money-weighted) | ✓ | ✓ | Undocumented | Not documented | ✗ |
| Time-weighted return | ✓ | ✗ | Undocumented | Benchmark charts | ✗ |
| Dividend forecast | ✓ | ✓ (3 yr, Standard+) | ✗ | ✓ | ✗ |
| Risk vs benchmark | ✓ | Drawdown report | You Index | Sharpe, benchmarks | ✗ |
| Fund fee analytics | ✓ | ✗ | ✓ | ✗ | ✗ |
| Research & screening | ✓ | ✗ | ✗ | Minimal | ✗ |
| Banks, cards, net worth | ✗ | ✗ | ✓ | ✗ | ✓ |
| Tax reporting | Realized gains | AU/CA CGT; US on average cost | ✗ | ✗ | Rough estimate |
| Annual cost | $348–$948 | $0–$279 | $0 | $0–$250 | $250–$2,500 |
Two checks make performance numbers mean something. First, benchmark correctly: compare your time-weighted return to an index, and your money-weighted return to your own goals; mixing them flatters or punishes you for cash-flow timing that the index never experienced. Second, know what moves together: a portfolio of ten stocks that all track the same factor is one bet wearing ten tickers. Stock Rover’s portfolio analytics cover both: risk measured against the S&P 500, and a correlation view showing how your holdings move relative to each other.
The practical answer for many investors is two tools: Empower free for the household (net worth, retirement planning) plus Stock Rover for the investing (research, screening, performance truth). Sharesight earns its seat when significant non-US holdings enter the picture, and Snowball when the dividend dashboard itself is the daily pleasure you pay for.
Link your accounts and get the full Portfolio Performance Report in minutes, free for 14 days.
Disclosure: Stock Rover publishes this page. Competitor pricing verified October 1, 2026 against each vendor’s published plans. See also: all comparisons · the Portfolio Performance Report · Best Dividend Stock Screener.