
Annotating with Lines
Annotating with Lines
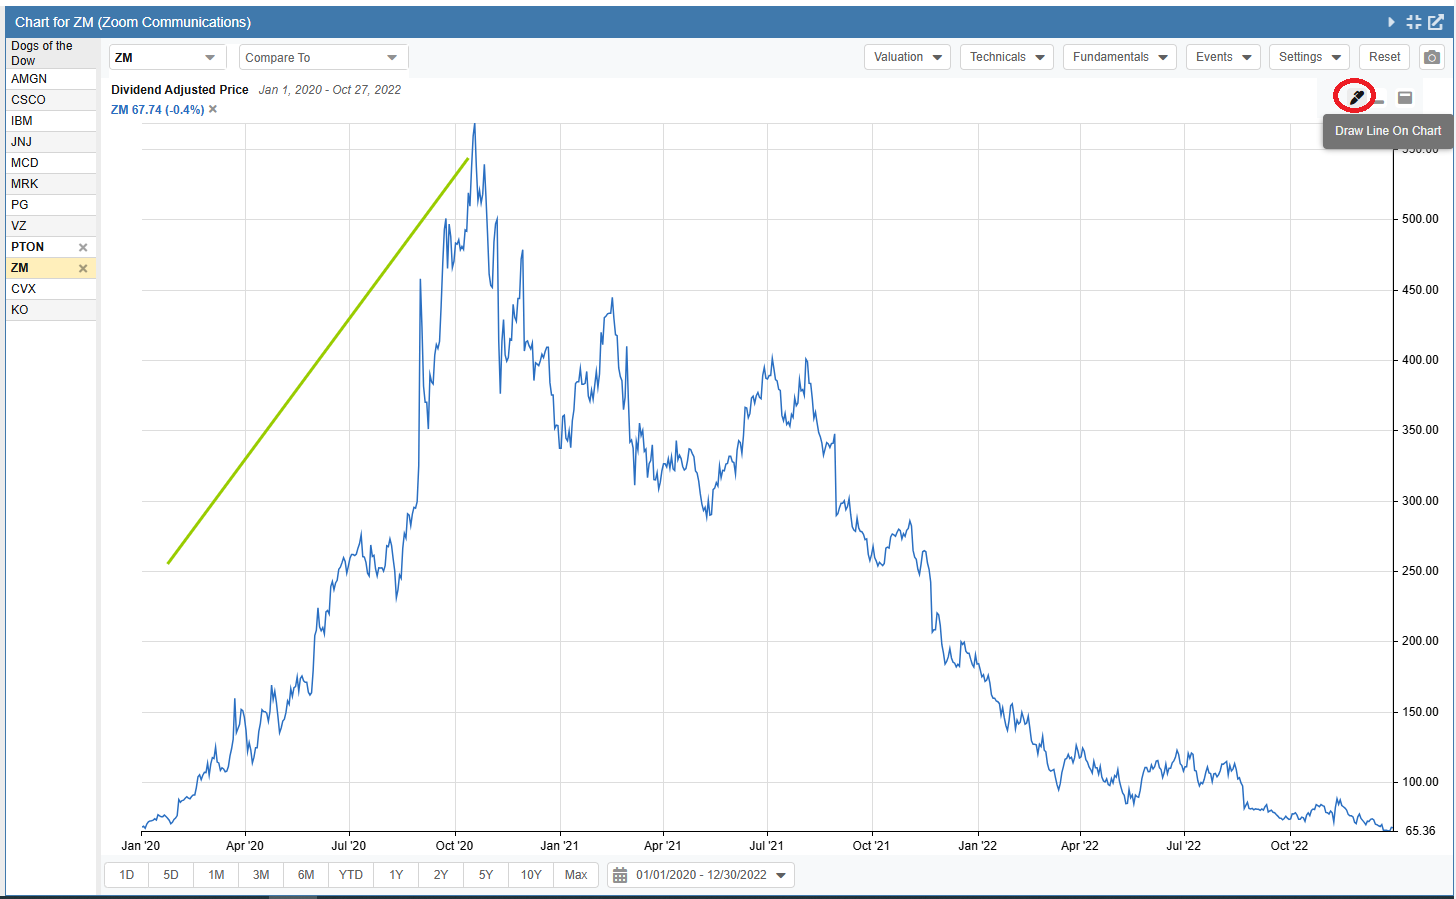
You can draw lines directly on the chart to highlight trends, support and resistance levels, or other technical patterns. To begin, click the pencil icon (“Draw Line On Chart”) in the upper right corner of the chart area.
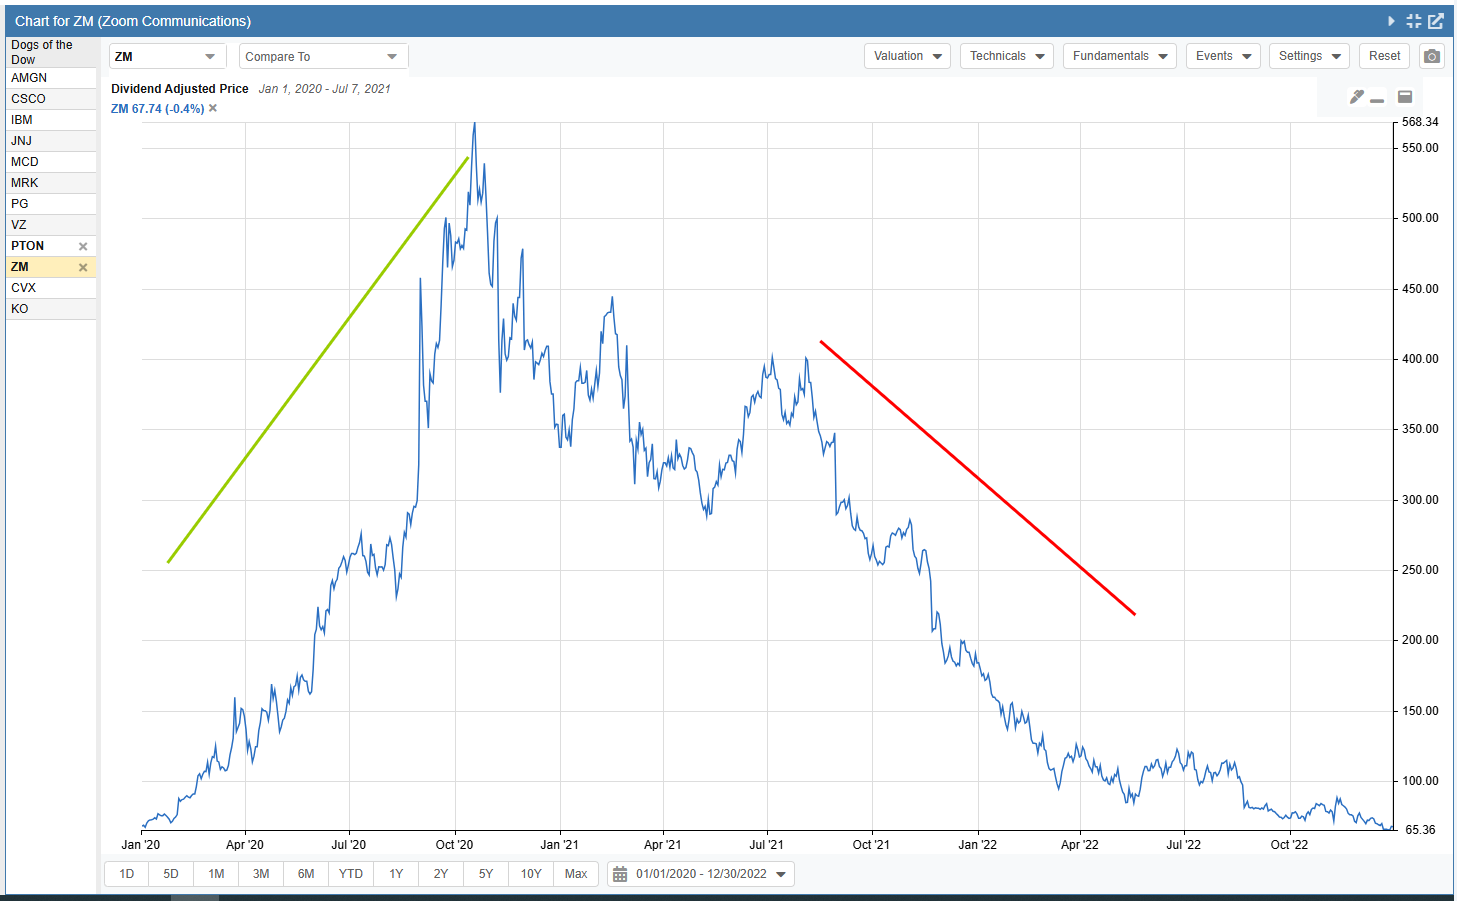
Click on the chart to set the starting point, drag your mouse, and click again to set the endpoint. You are not limited to a single line; you can repeat this process to draw multiple lines on the same chart.
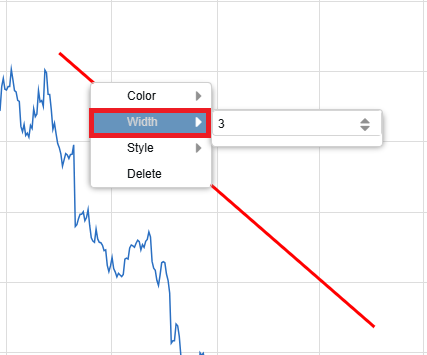
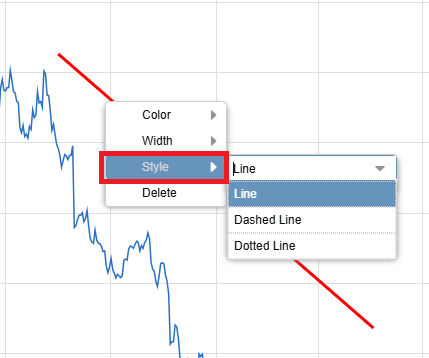
Once a line is drawn, you can configure its appearance by clicking directly on the line. This opens a menu where you can adjust the following:
- Color: Select from a palette of available colors.
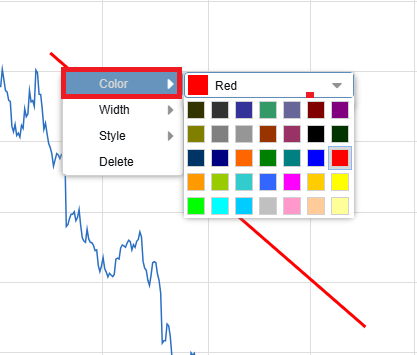
- Width: Increase or decrease the thickness of the line.
- Style: Choose between a solid, dashed, or dotted line.
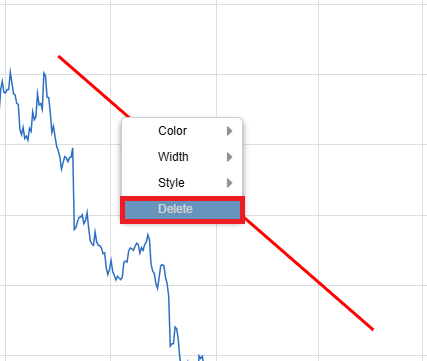
To remove a line, click on it and select Delete from the menu.
Note: Chart annotations are designed for active, single-session analysis. If you change the primary ticker being charted or load a different dataset into the viewing pane, your drawn lines will clear so you have a fresh canvas for the new asset.