Monthly Returns
Overview
The Monthly Returns section breaks down your portfolios’ performance on a month-by-month basis.
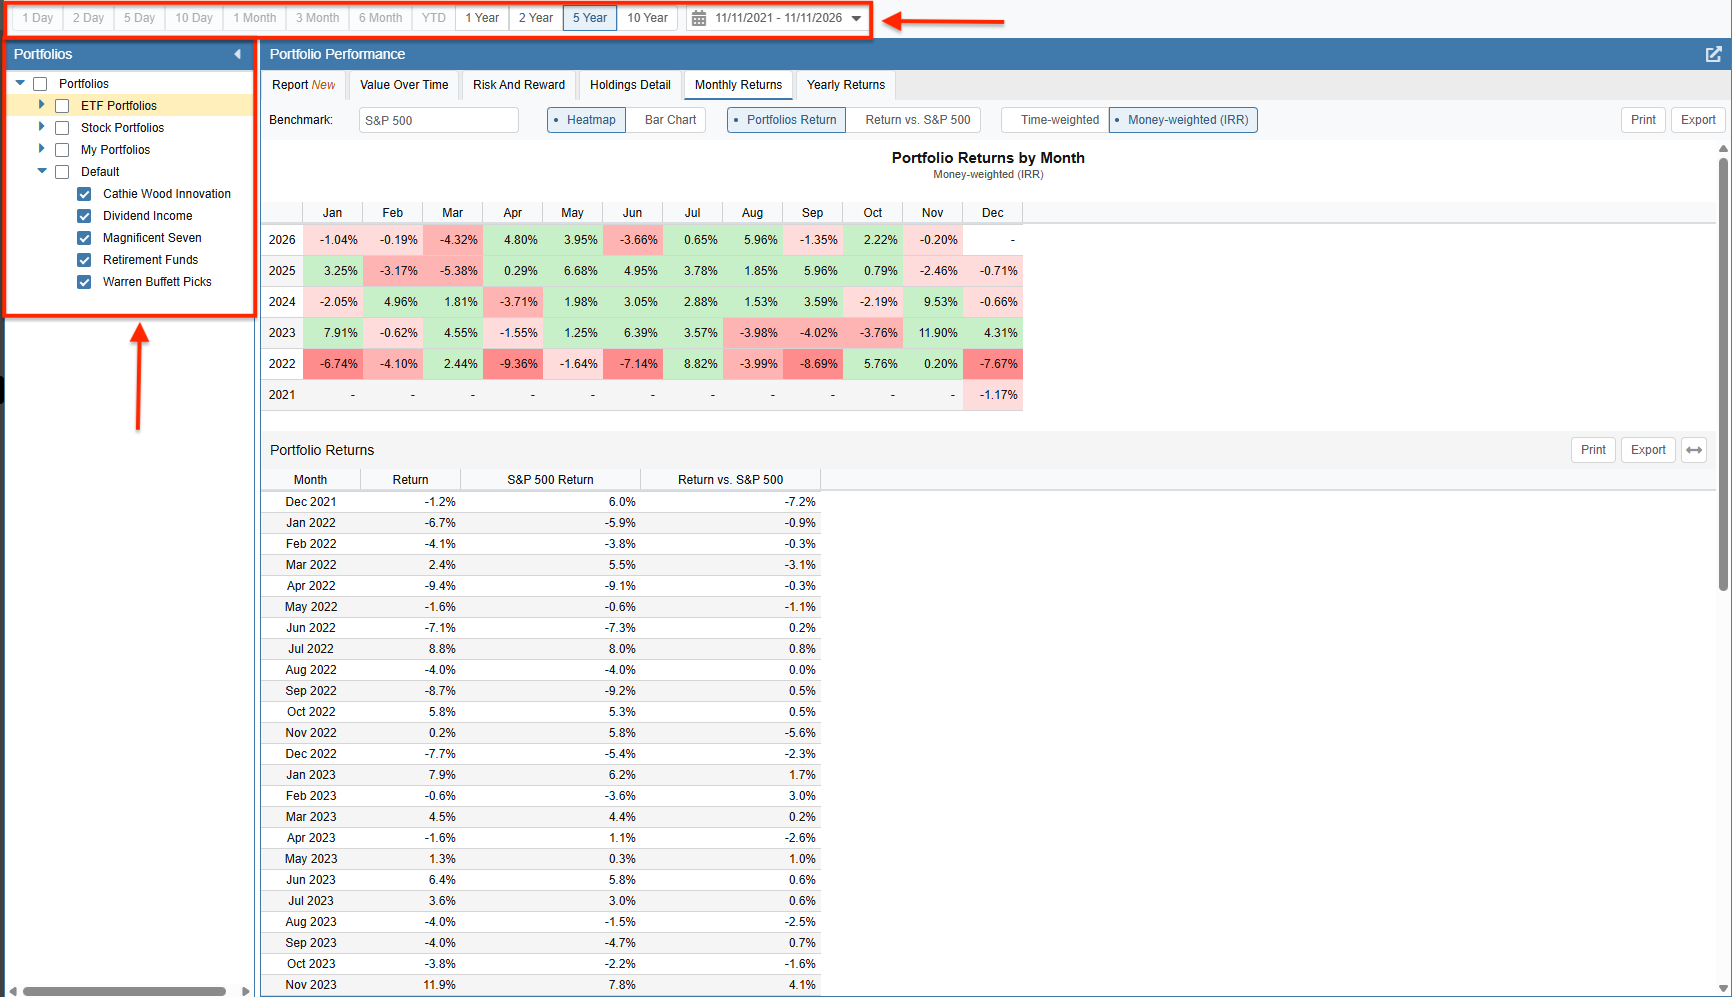
The portfolios you wish to analyze are selected on the left, and the desired timeframe is configured at the top.
Heatmap
The Heatmap view helps you identify seasonality patterns, trends, and return distributions over time.
A color gradient is used to instantly highlight return values:
- Green for positive returns (darker green for higher gains).
- Red for negative returns (darker red for larger losses).
- Neutral colors for near-zero returns.
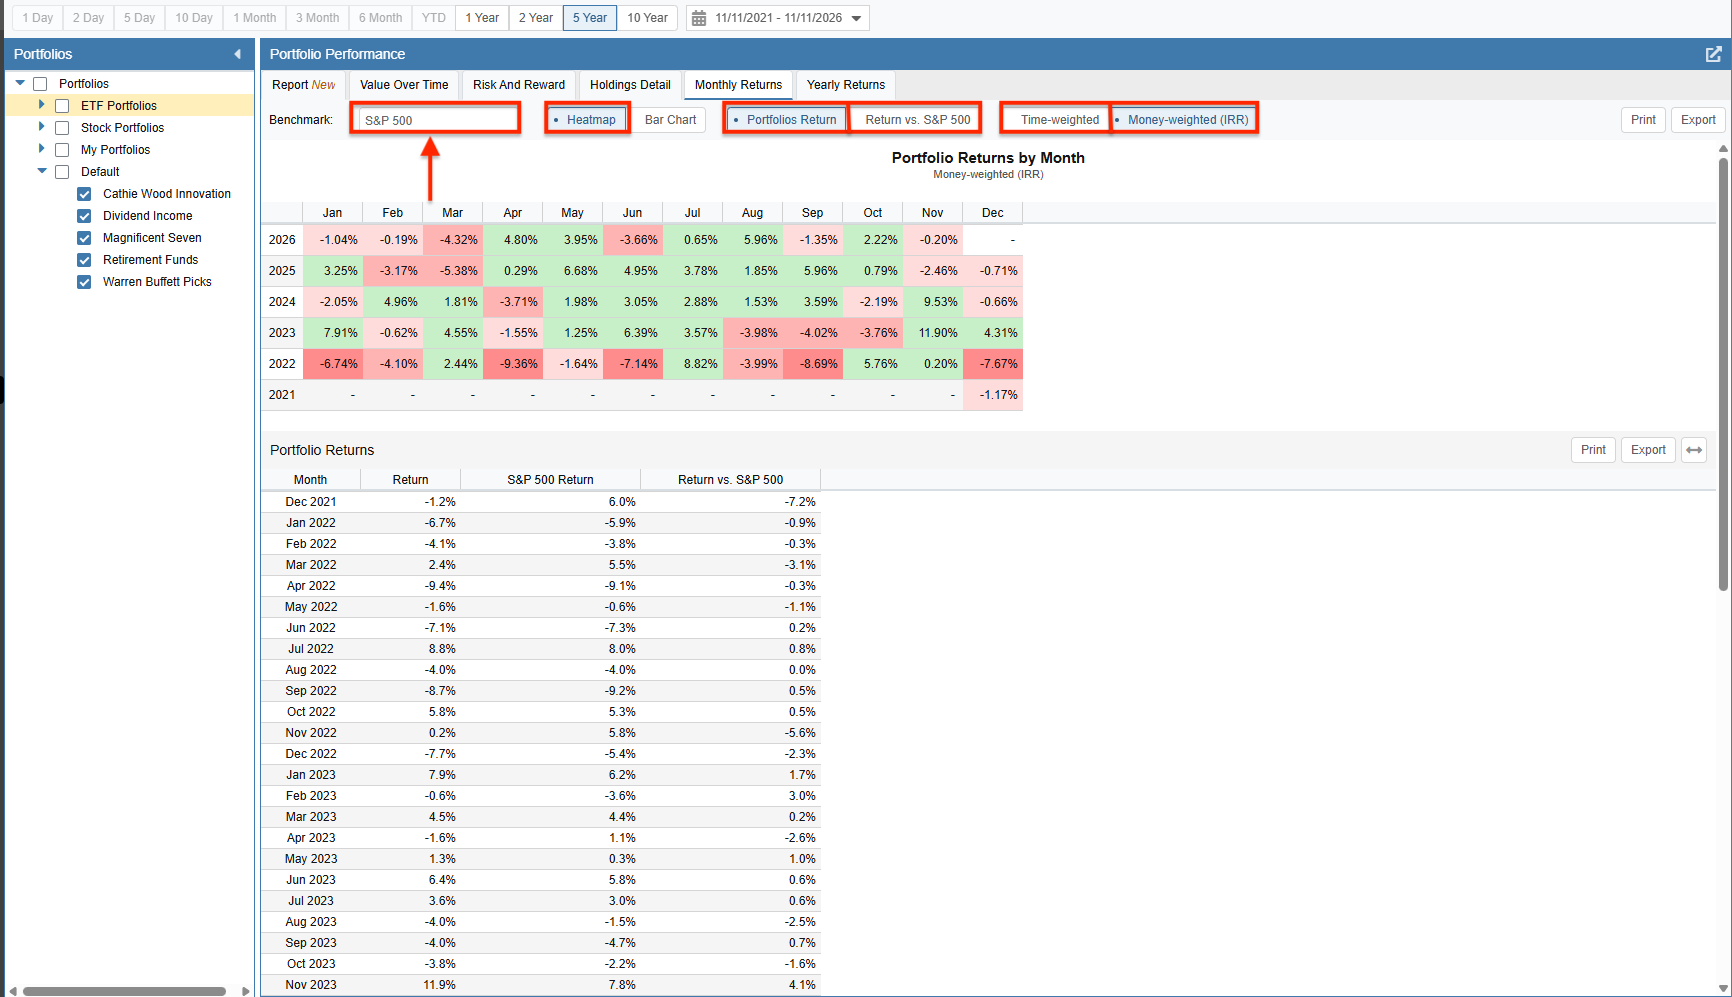
Using the controls directly above the Heatmap, you can customize your view:
- Benchmark: Select a market index (like the S&P 500) to act as your baseline for comparison.
- Data Display: Choose to view your absolute Portfolios Return, or toggle to the Return vs. [Selected Benchmark] option to see the exact percentage by which you outperformed or underperformed your chosen index each month.
- Return Methodology: Select between Time-weighted returns (measuring pure asset performance) or Money-weighted (IRR) returns (factoring in the timing of your personal cash flows).
Below the heatmap is the Portfolio Returns table. This provides the raw numerical data for each month, displaying your return, the benchmark’s return, and the relative outperformance or underperformance.
Bar Chart
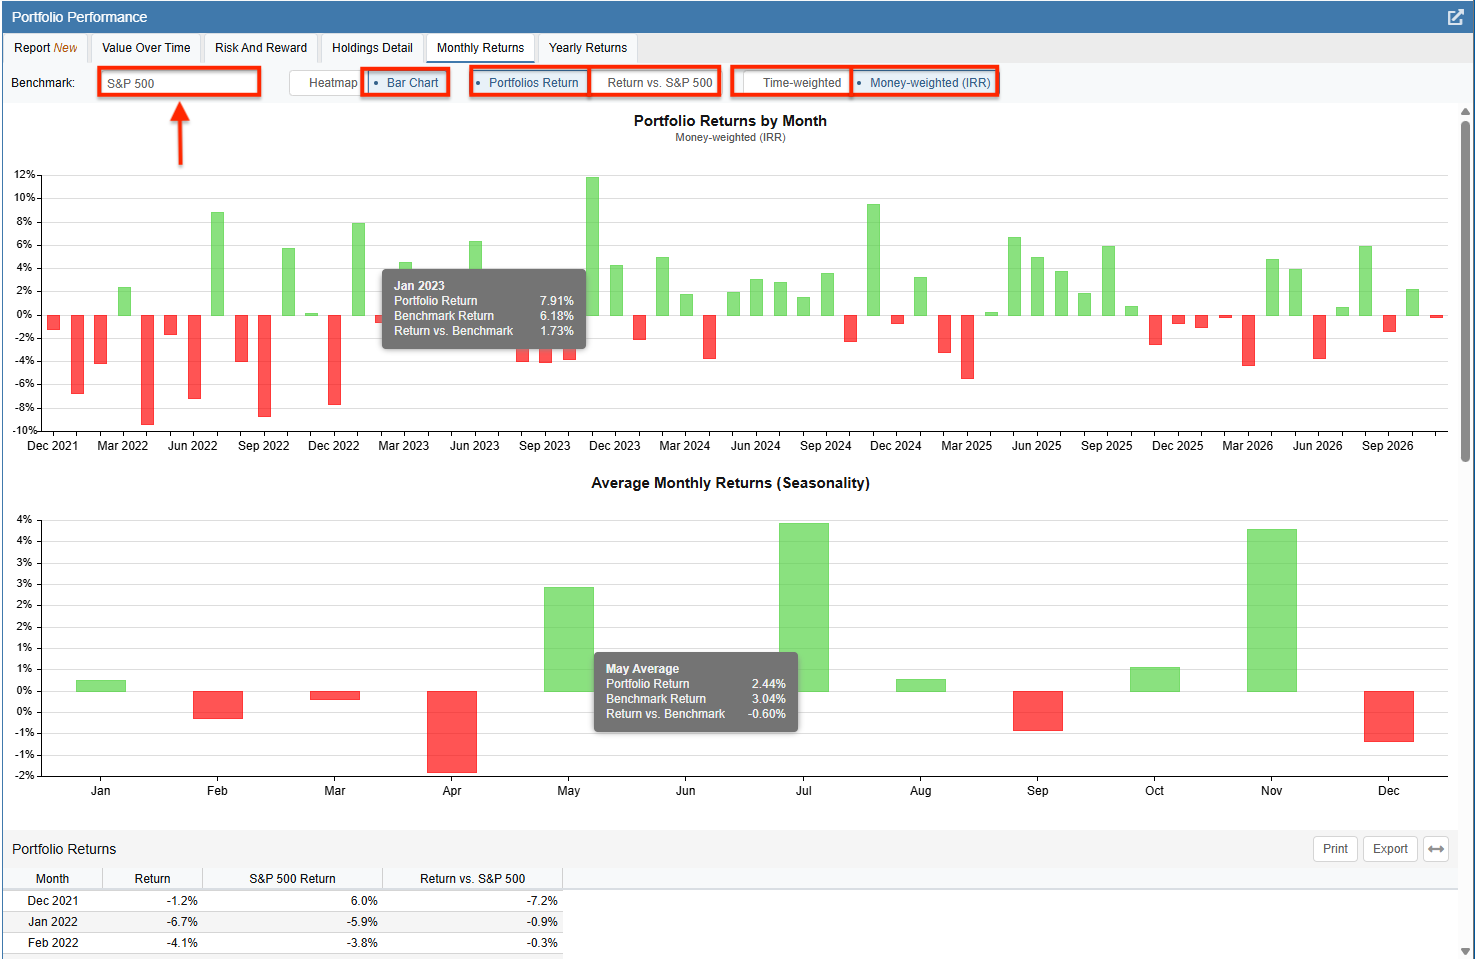
Switching from the Heatmap to the Bar Chart view provides a clear visual representation of your performance trajectory.
The Bar Chart view is split into two distinct graphs:
- Portfolio Returns by Month: A chronological bar chart tracking your specific percentage returns over the selected timeframe.
- Average Monthly Returns (Seasonality): A consolidated 12-month chart that averages your historical returns for each specific month (January through December) across your selected timeframe, helping you identify recurring annual patterns.
Like the Heatmap, you can configure the Bar Chart to display absolute returns or your relative returns versus your selected benchmark. Hovering your mouse over any bar in either chart will trigger a tooltip displaying the exact portfolio return, benchmark return, and the difference between the two.