Risk and Reward
Overview
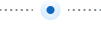
Risk and Reward quantifies the amount of risk taken to achieve your investment returns. Key metrics include Return vs. the S&P 500, Maximum Drawdown, Volatility, Risk-Adjusted Return, and the Sharpe Ratio. This tab features a performance table at the top and a dual-chart panel at the bottom showing both Price Change and Value Over Time.
The portfolios you wish to analyze are selected on the left, and the desired time period is configured at the top.
Table
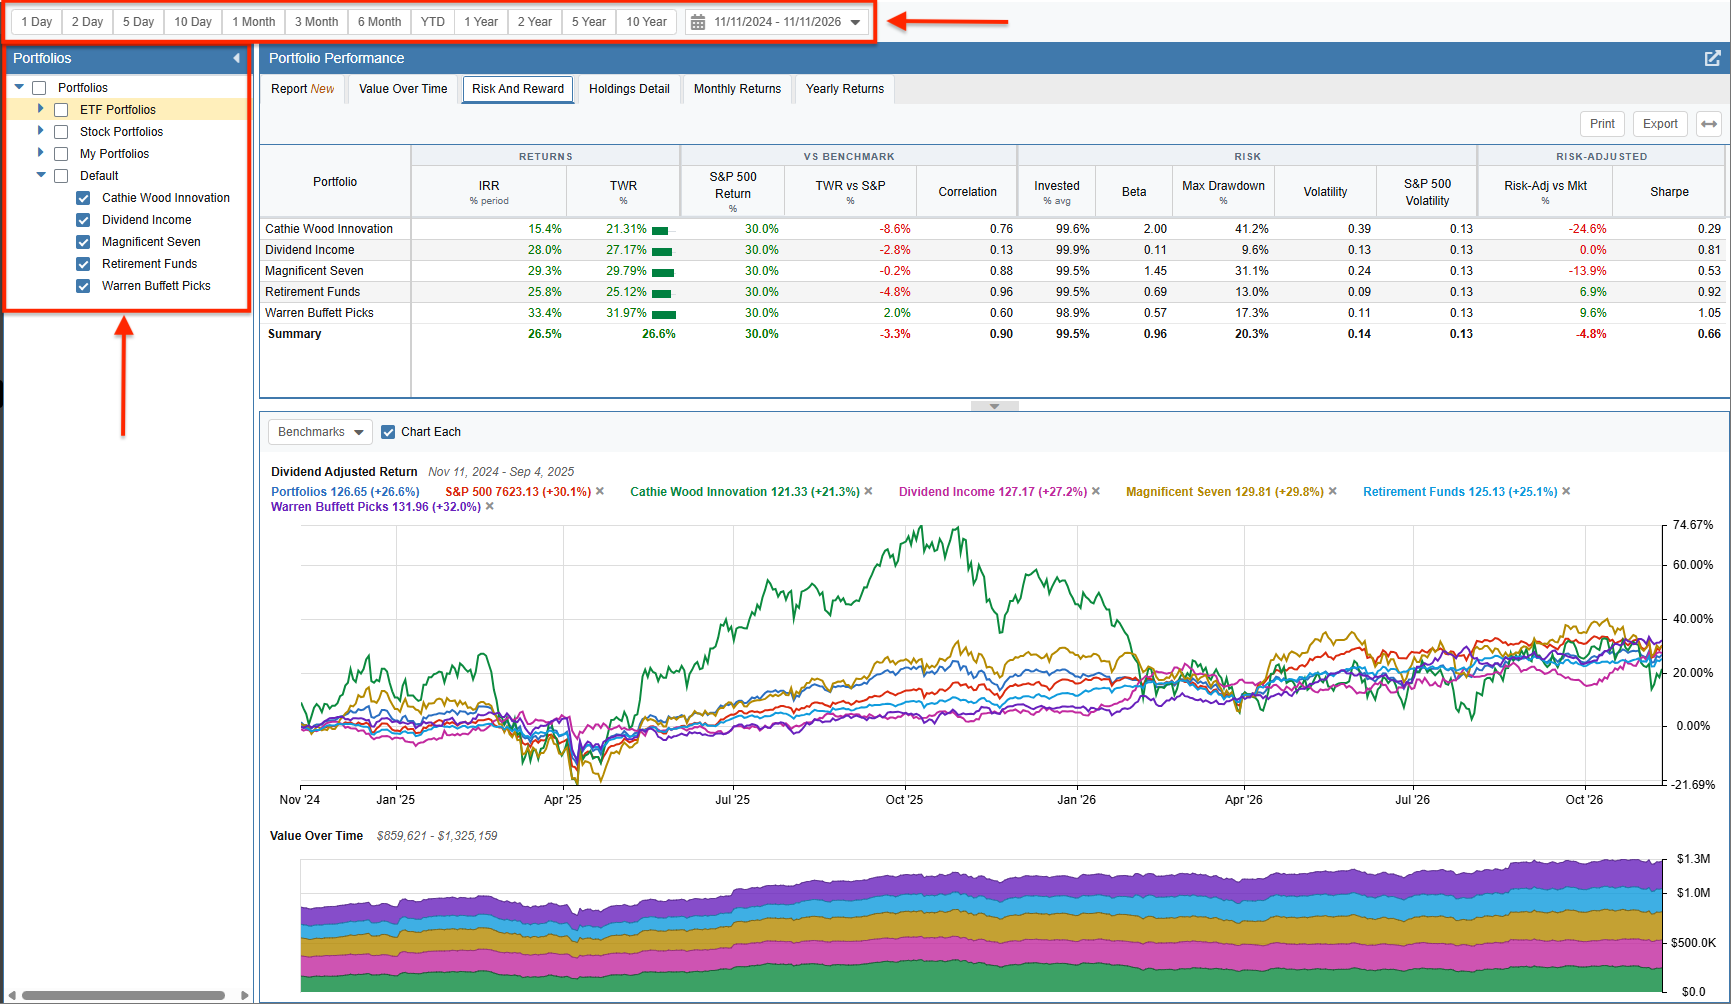
The table (shown below) displays the following measures of your portfolios’ risk and return over the selected period:
- Portfolio
- IRR (% period)
- TWR (%)
- S&P 500 Return (%)
- TWR vs S&P (%)
- Correlation
- Invested (% avg)
- Beta
- Max Drawdown (%)
- Volatility
- S&P 500 Volatility
- Risk-Adj vs Mkt (%)
- Sharpe
You can sort the rows in the table by any of these metrics by clicking on the column header. Clicking a header twice will reverse the sort order. You can also right-click any column header and select the ‘Explain’ option to view the technical definition of that metric.
Price Change Chart
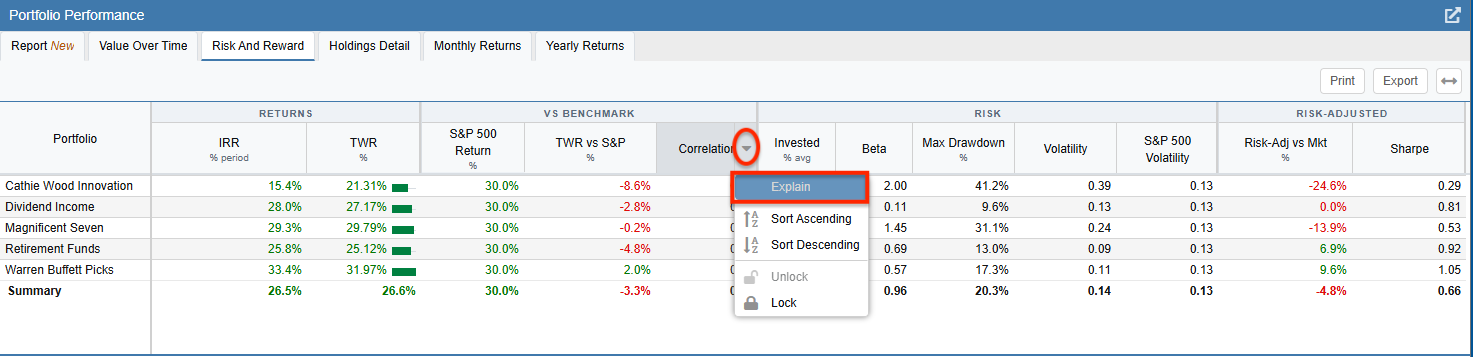
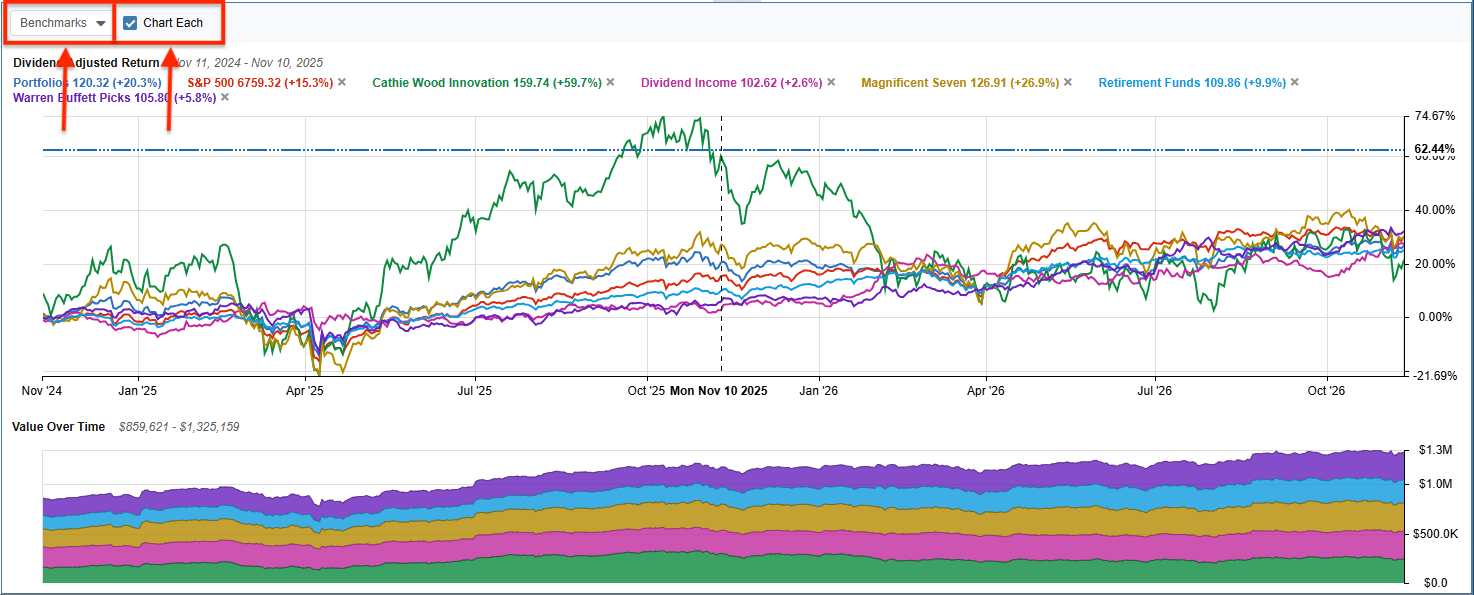
The top chart is the Price Change chart. This allows you to chart your portfolios as one combined line or view them individually by selecting the ‘Chart Each’ option. Hovering your mouse over the chart will display a crosshair, allowing you to pinpoint the exact return percentage for any specific date.
Benchmarks can be added to the Price Change chart from the Benchmarks pull-down menu. Any benchmarks previously configured for the portfolio in the Portfolio Manager will also appear in this list.
Value Over Time Chart
The Value Over Time chart is located at the bottom and tracks the absolute dollar value of the selected portfolios. Hovering your mouse over the chart will trigger a tooltip showing the exact value of your holdings on any specific date.