
Keeping Track of your Portfolios in Stock Rover
 Printer Friendly
Introduction
Understanding how your portfolios are performing is critical to helping you make sound investment decisions and for prudent portfolio management.
Manually tracking portfolio performance can be a daunting task. It becomes even more complicated when multiple brokerages enter into the equation. For example, you could track some basic portfolio performance metrics by maintaining an elaborate spreadsheet, but this is both time-consuming and error-prone. Plus, tracking key portfolio performance metrics such as risk-adjusted return, benchmark correlations, and volatility would likely be beyond the capabilities of spreadsheet tracking.
This article focuses on the Stock Rover features designed to help you monitor and evaluate your portfolios. We will explore features like the Dashboard, deep portfolio research, the comprehensive Portfolio Performance tools (including the Portfolio Performance Report), automated emailed performance reports, and alerting.
Note: While the Dashboard is available to all Stock Rover users (including those on the Free plan), the advanced research, performance reporting, and alerting tools discussed below require a Stock Rover subscription.
The Stock Rover Dashboard
The Stock Rover Dashboard delivers a consolidated performance overview of your selected portfolios.
The panel-based Dashboard organizes your critical daily monitoring workflow into focused, interactive modules:
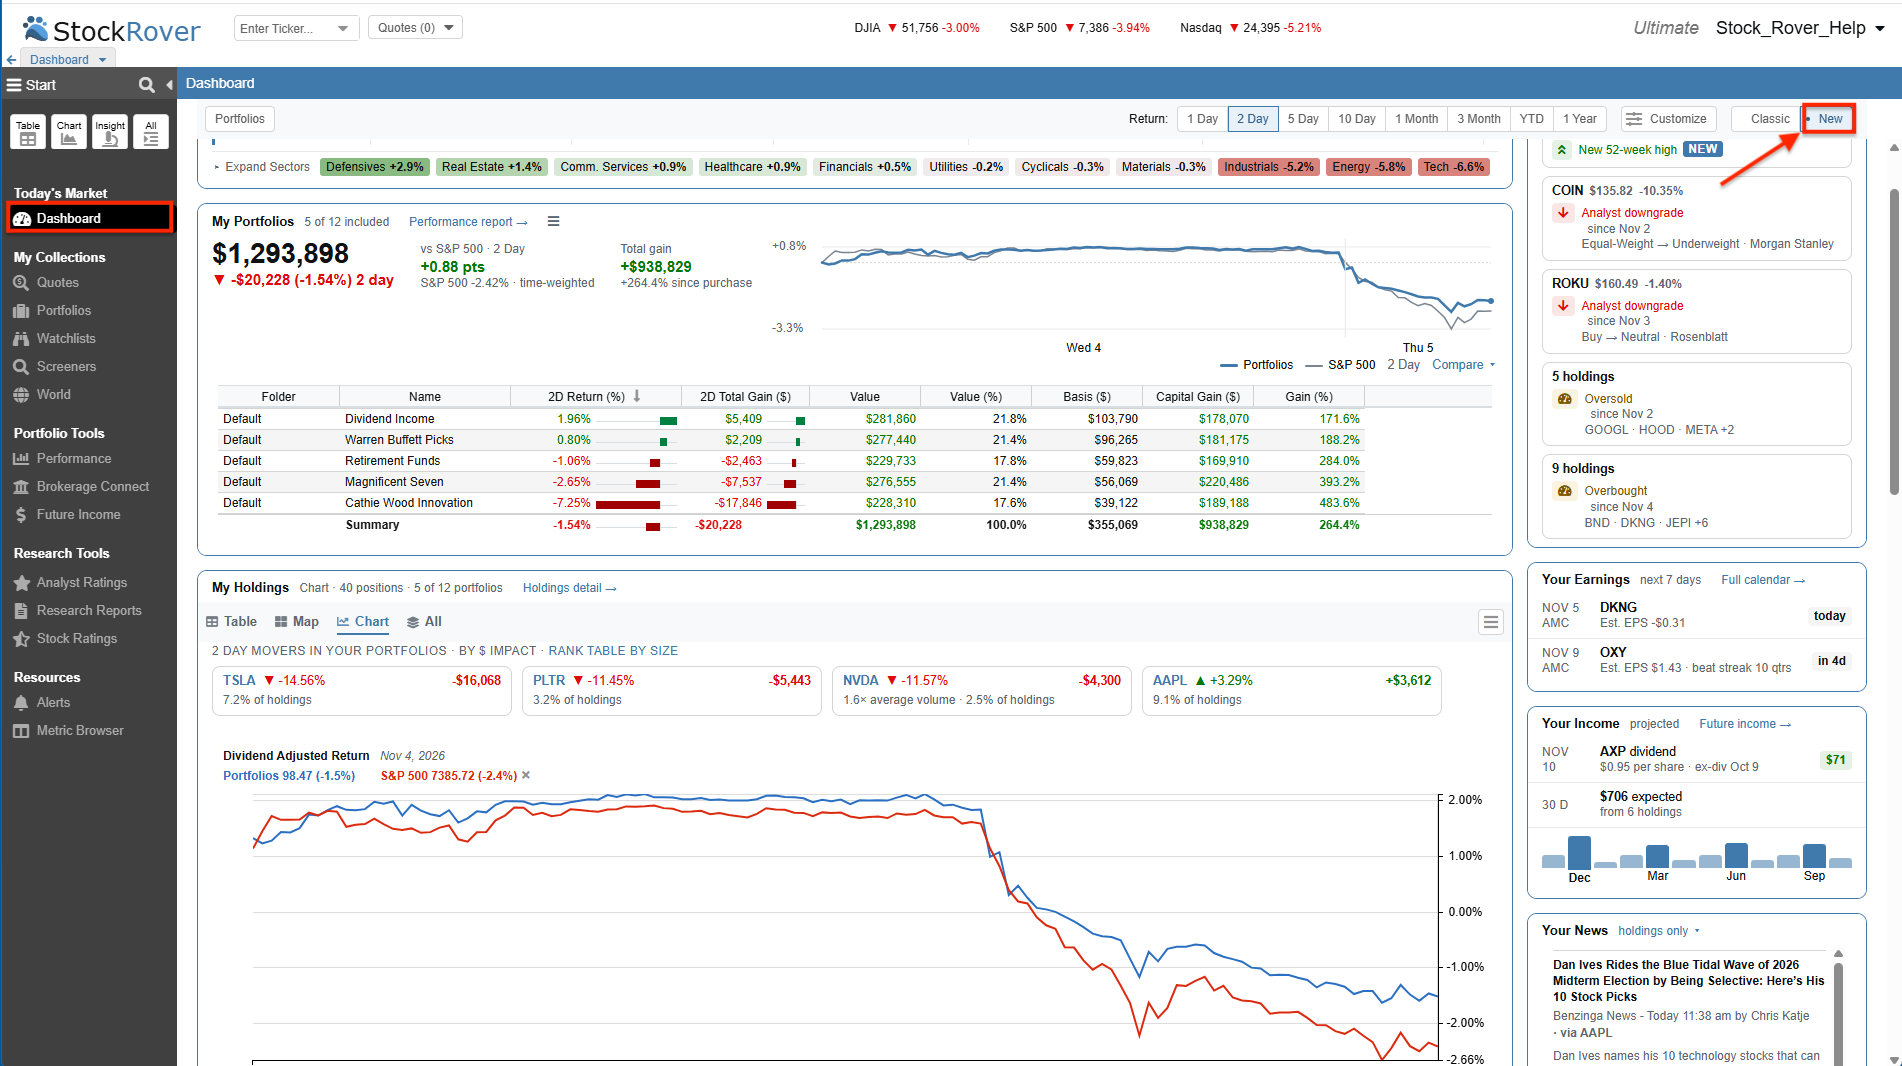
The Dashboard provides a unified view of your portfolios, holdings, and daily insights.
My Portfolios: Your Wealth at a Glance
The My Portfolios panel provides an immediate summary of your wealth creation over your chosen time period. The top banner highlights your total overall portfolio value, compares your Time-Weighted Return directly against your selected benchmark, and details your total net gain.
Directly beneath the aggregate summary, an interactive table itemizes the return, overall value, and capital gains of each individual portfolio, making it simple to pinpoint exactly which accounts are driving overall returns.
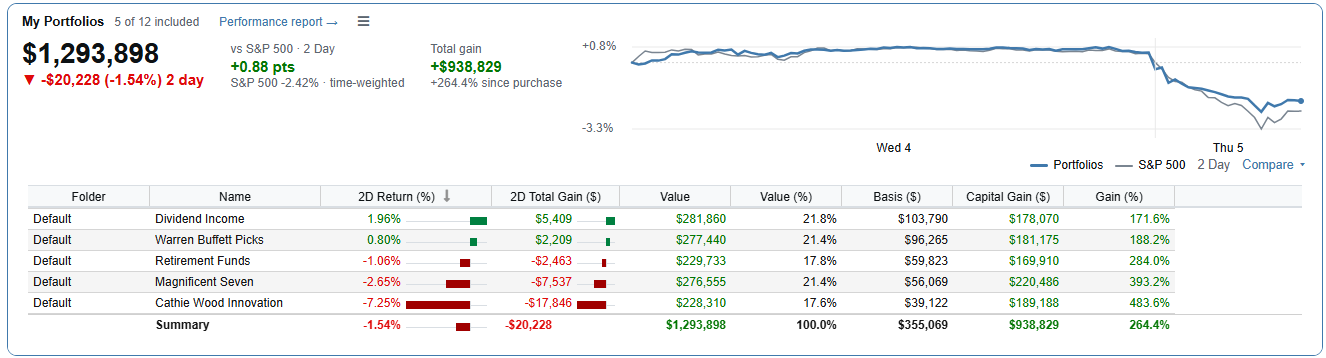
The My Portfolios panel breaks down aggregate wealth and individual account performance.
My Holdings: Your Positions in Focus
The Dashboard consolidates your position-level tracking into a single, unified My Holdings panel. You can easily toggle between dedicated Table, Map, and Chart formats or select All to see all three. Your view preference is sticky, meaning the Dashboard remembers whichever layout you used last.
- Table View: Offers three distinct layout presets to match your workflow: Simple (core price and return metrics), Standard (adds quantity and portfolio locations), and Detailed (expands to include cost basis, 52-week ranges, and sector classifications). All views feature a top banner highlighting your biggest movers by dollar impact.
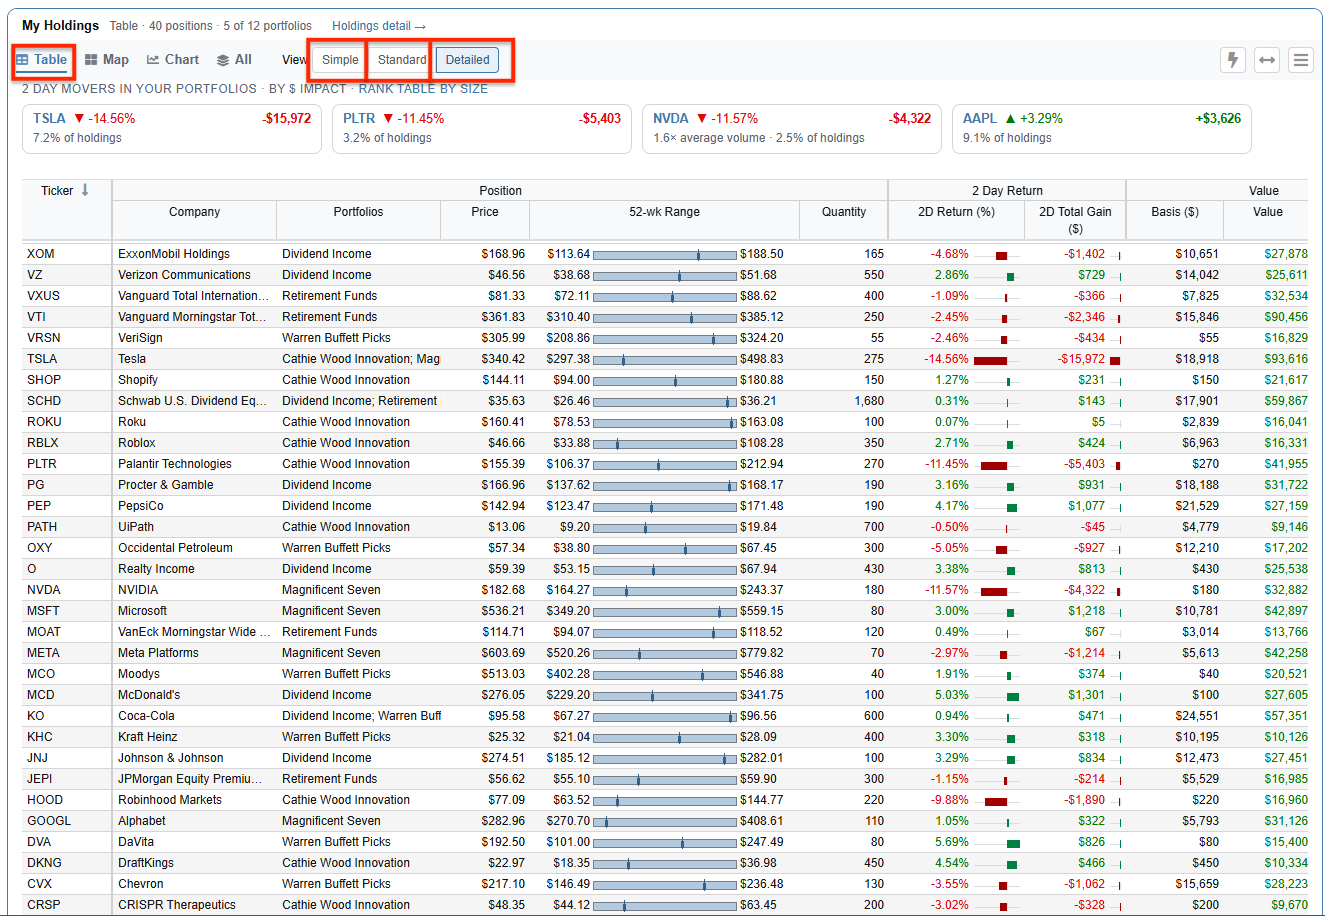
The unified My Holdings panel lets you switch effortlessly between formats.
- Map View: Displays an interactive heatmap of holdings across your portfolios, with tile sizes corresponding to dollar values and colors reflecting return. The tickers are grouped by sector in the heatmap.
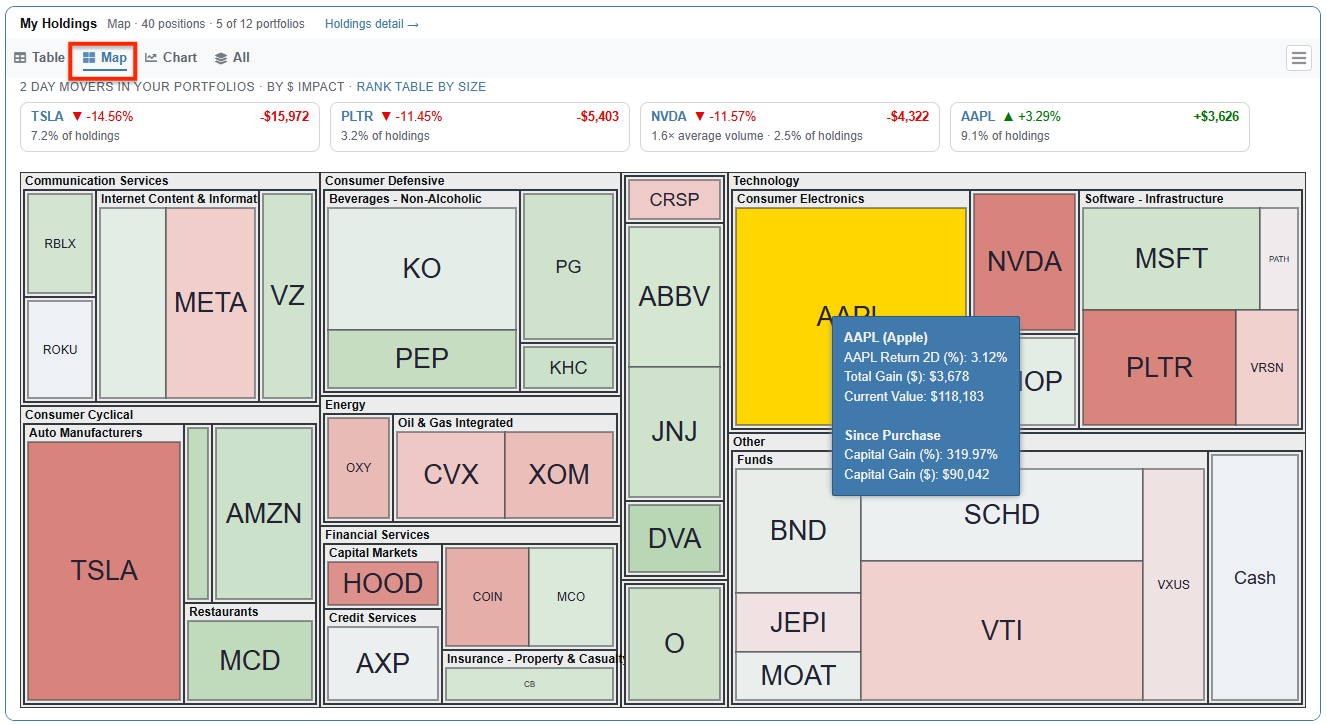
The Map view visualizes daily performance and position sizing across portfolios.
- Chart View: Displays the dividend-adjusted return against a benchmark and the Value Over Time of your holdings, featuring an interactive tooltip that reveals specific daily metrics on hover.
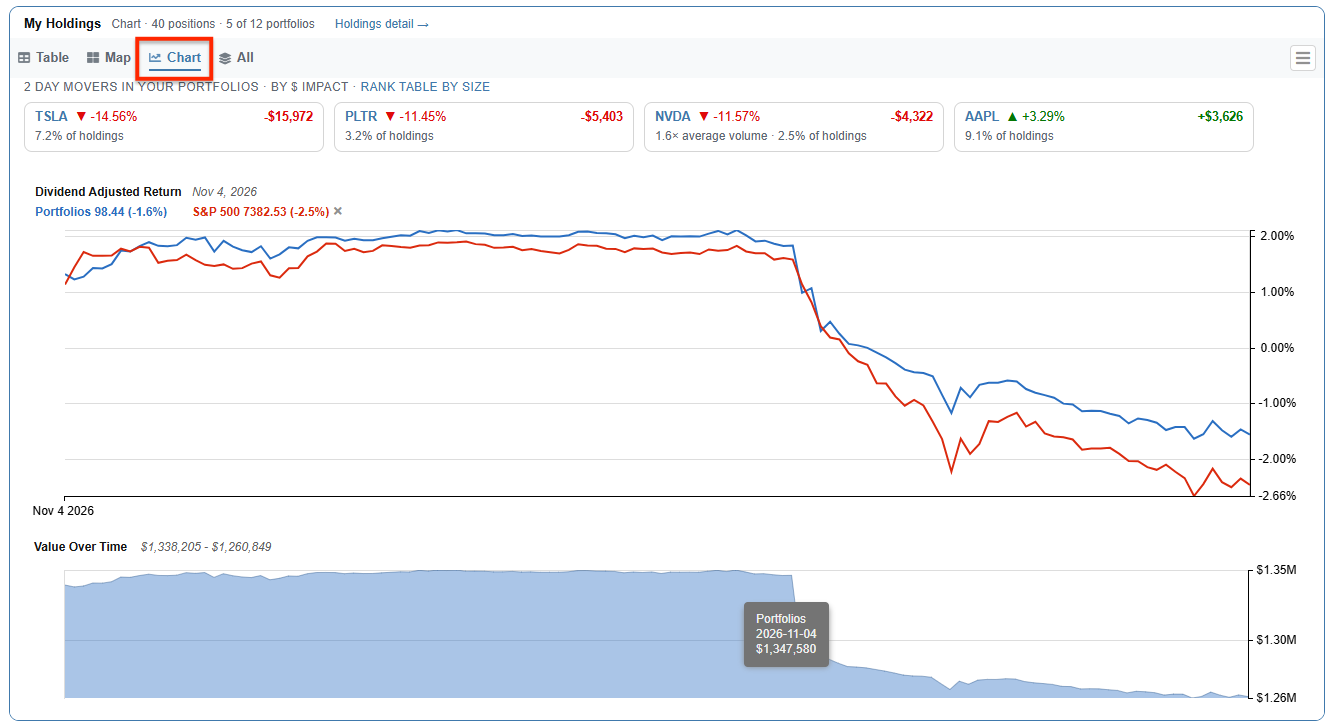
The Chart view embeds performance and Value Over Time directly into your Dashboard.
Allocation Breakdown
The Allocation panel provides an interactive visual representation of how your capital is distributed. You can instantly examine your sector exposure compared directly against the S&P 500 benchmark, as well as your high-level asset allocation across individual stocks, ETFs, and cash reserves.
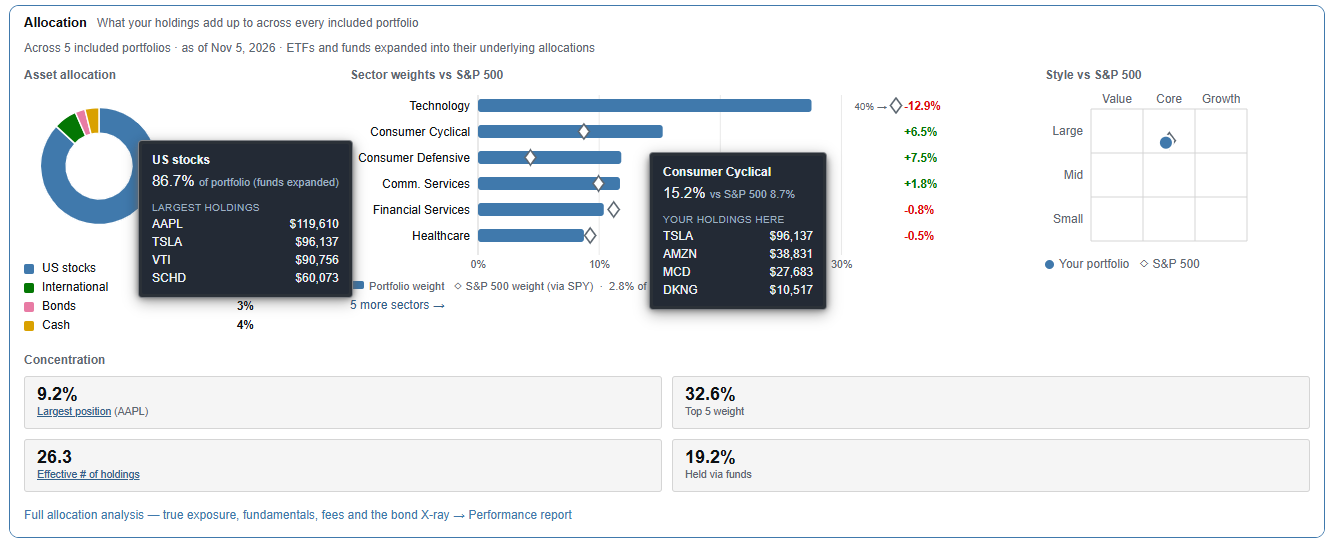
Compare your portfolio sector weightings directly against the S&P 500.
The Right Side Rail
The right column brings time-sensitive, actionable alerts and updates into one consolidated space:
- Your Signals: Automatically monitors your holdings for key technical and fundamental triggers:
- New 52-Week High and New 52-Week Low reached today.
- Analyst Upgrade and Analyst Downgrade applied within the last five days.
- New or Resumed Coverage initiated within the last five days.
- Overbought (RSI ≥ 70) and Oversold (RSI ≤ 30) technical conditions.
- Your Earnings: Chronologically tracks upcoming earnings report dates specifically for the equities you own.
- Your Income: Displays a projected breakdown of upcoming dividend payments to help you monitor incoming cash flows.
- Your News: Streams curated headlines filtered exclusively for your portfolio holdings.
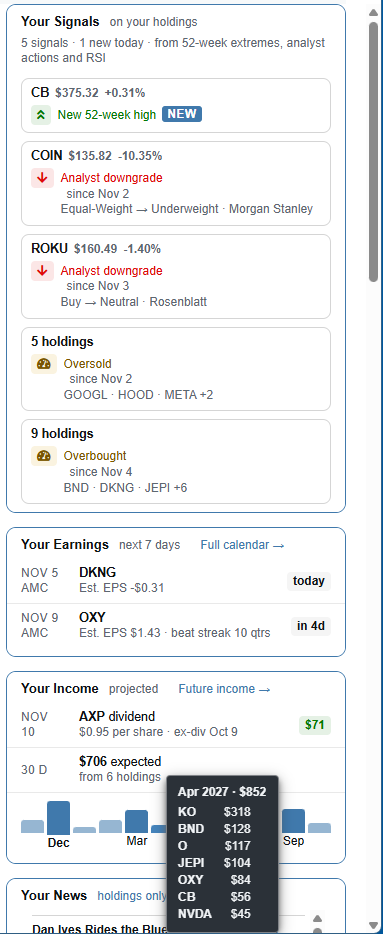
The Right Side Rail keeps your actionable alerts and targeted news one click away.
Deep Research Tools
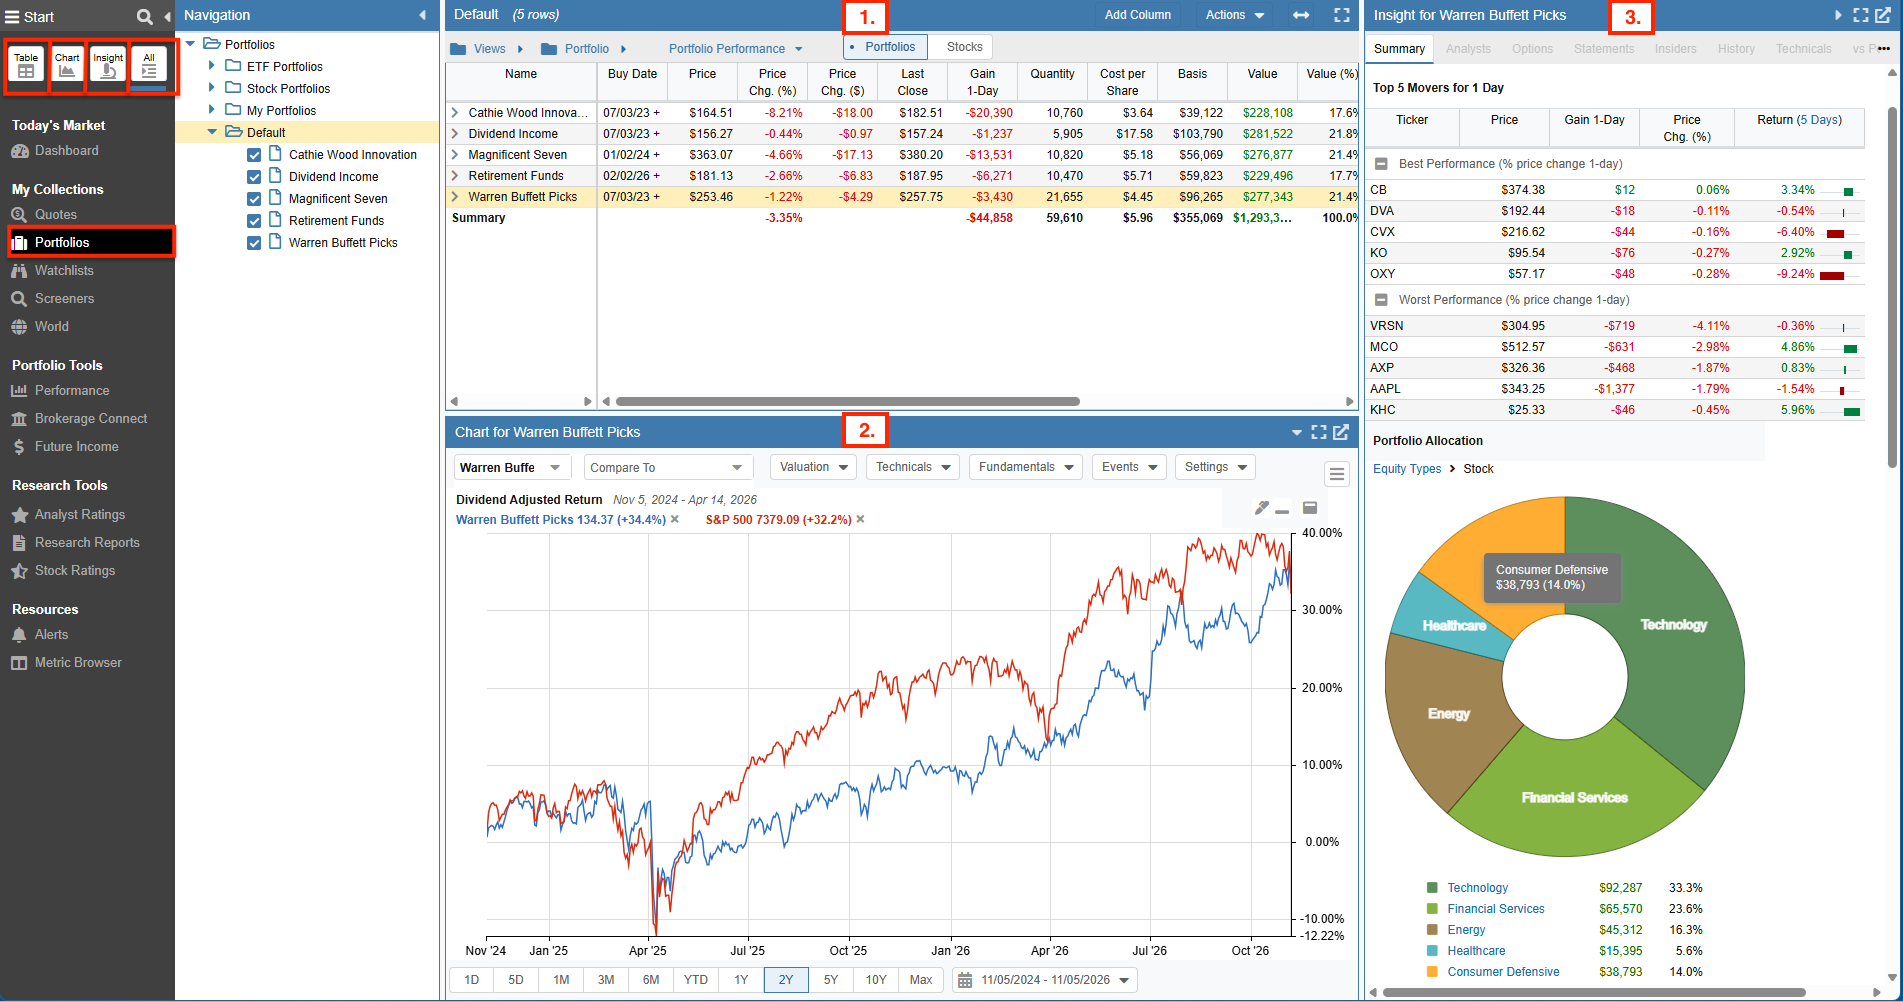
To move beyond dashboard summaries into deep security research, first select Portfolios under My Collections in the Start Menu. Clicking directly on a single portfolio in the Navigation pane allows you to research that specific portfolio and its underlying tickers. If you enable Multi-select mode, you can combine multiple portfolios to access both aggregate portfolio-level metrics and ticker-level research across all selected accounts. From there, the icons at the top of the Start Menu give you complete access to Stock Rover’s core analytical capabilities:
- Table: A flexible spreadsheet interface for viewing portfolios, watchlists, and screening metrics side by side.
- Chart: A charting workspace offering benchmarking, valuation overlays, and technical events like maximum drawdown.
- Insight: A deep-dive panel for analyzing individual equities and portfolio fundamentals.
Table
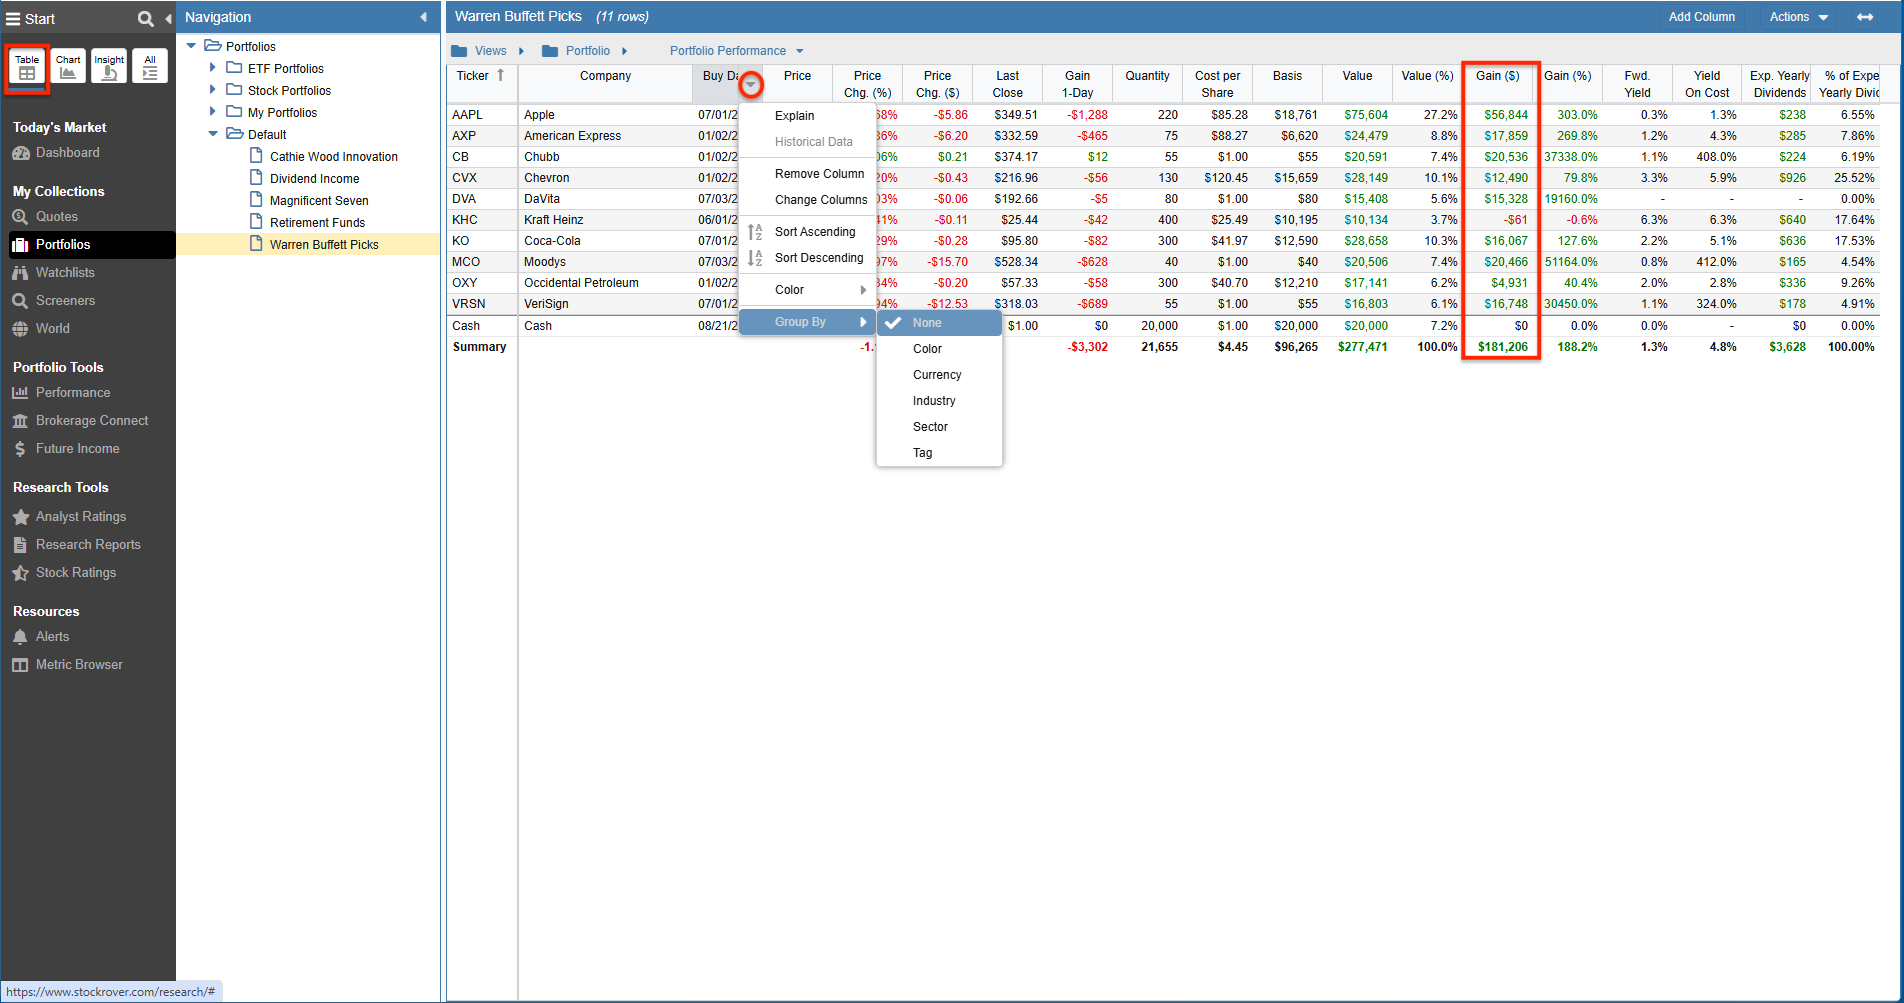
Within the Table, selecting the “Portfolio Performance” View gives you a moment-in-time display of the performance of your current holdings and the portfolio(s).
Because the Table acts as a moment-in-time tool, historical buys and sales of already-closed positions are not factored into the Table’s calculations. The Gain ($) column simply displays the difference between the purchase price and current market value of your existing holdings. Right-clicking column headers allows you to access historical data, add or remove columns, sort, and group.
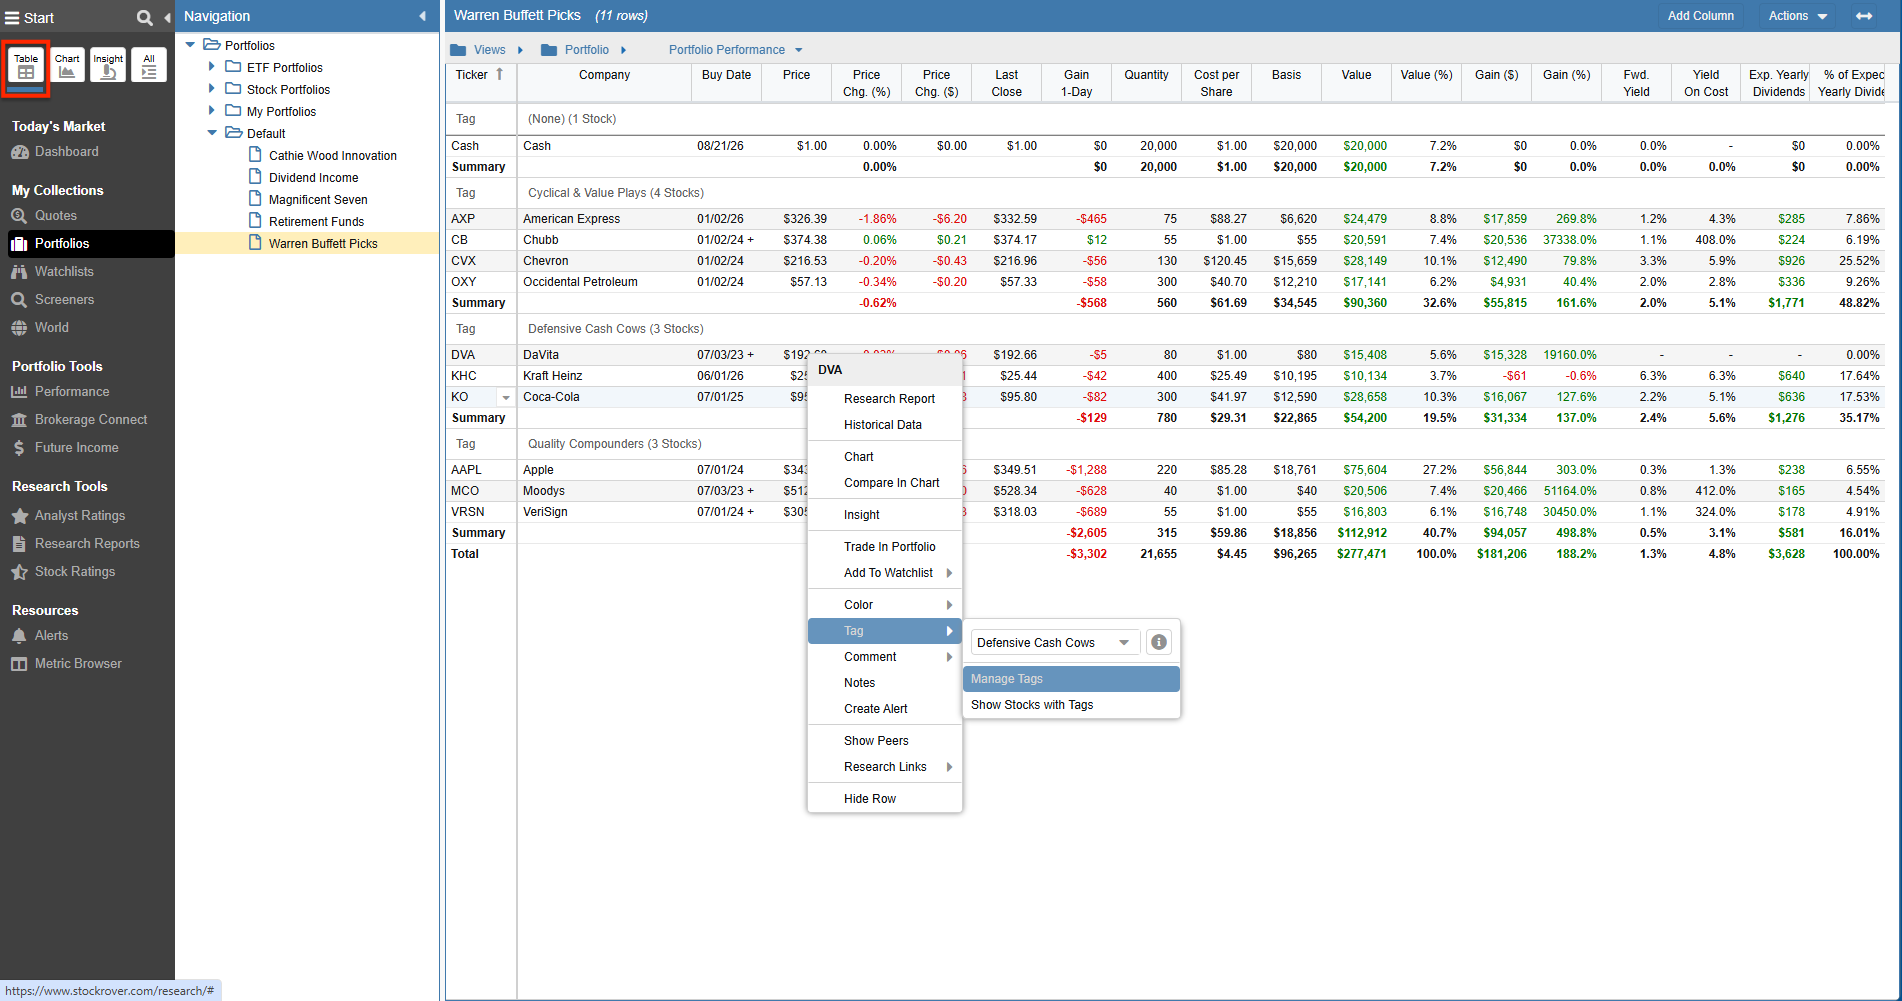
Right-clicking rows opens options to append comments and notes, or apply colors and tags. You can then use the grouping menu to segment your holdings based on your custom categorization.
Chart
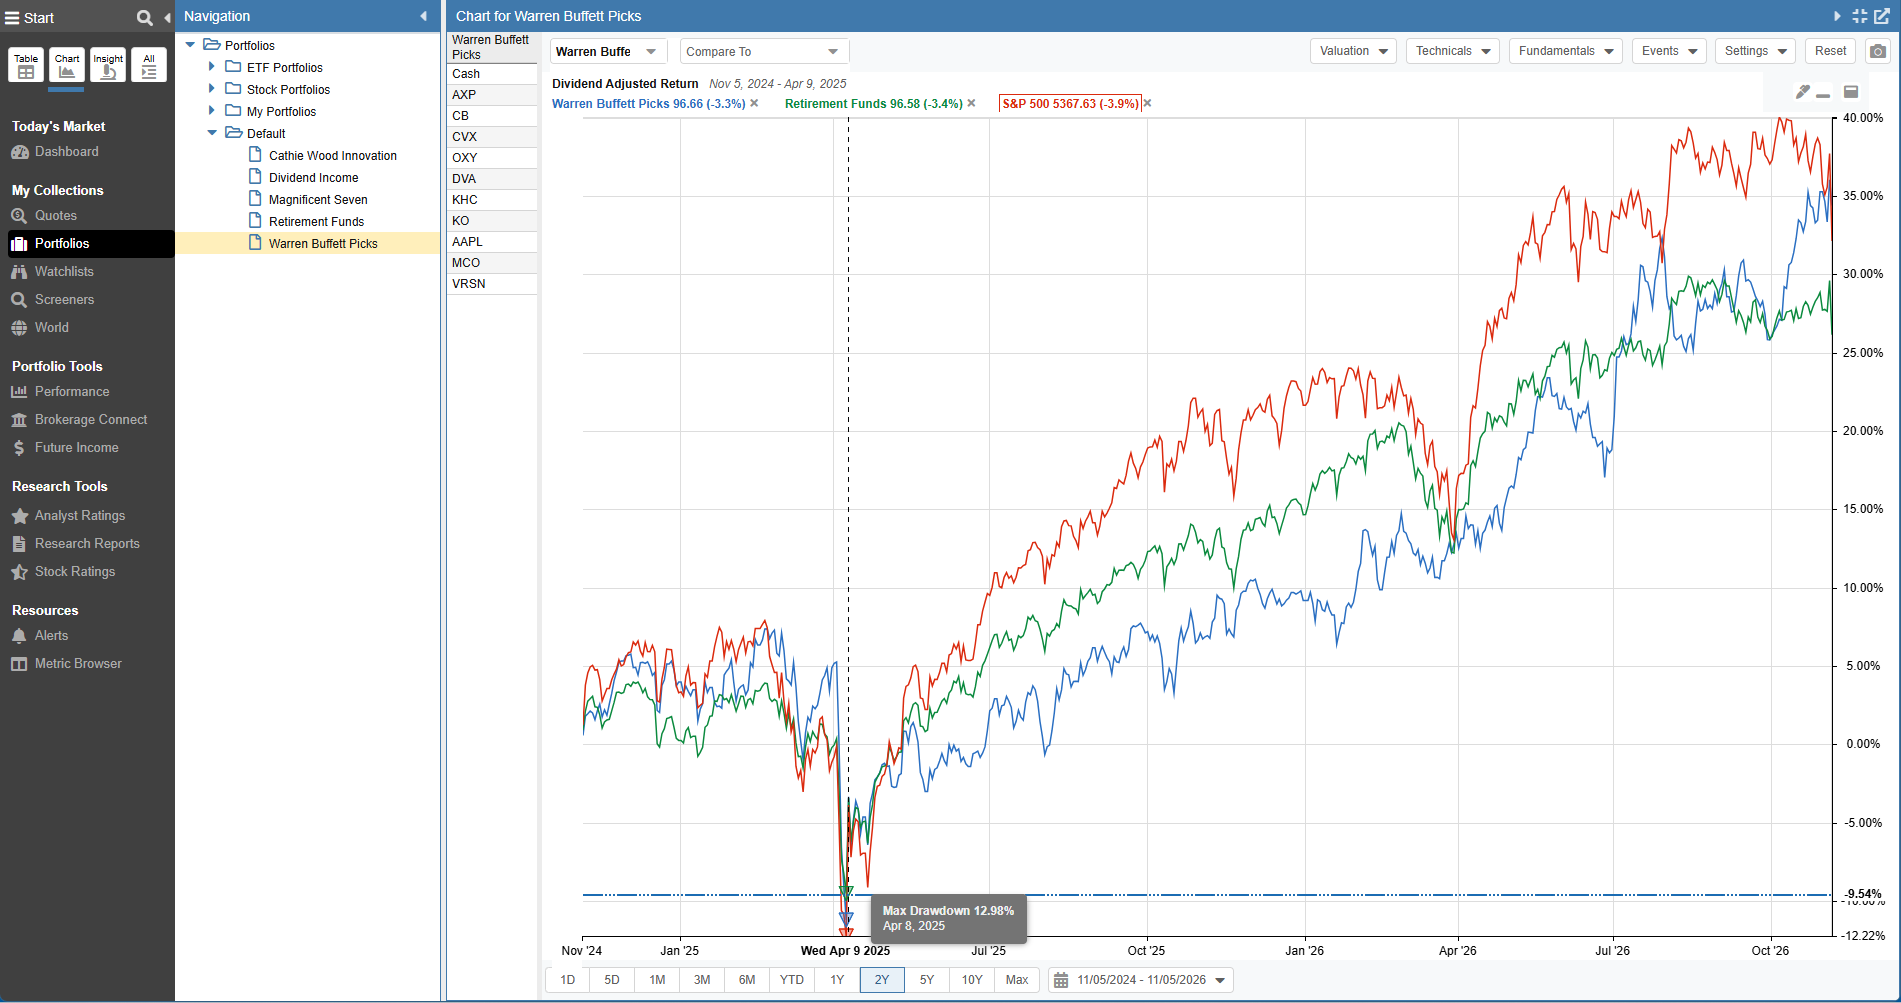
Stock Rover charts portfolio returns by weighting each security relative to total portfolio value. Furthermore, the charting engine accounts for trades by evaluating portfolio holdings on each calendar day across the charted window.
Returns are calculated using a time-weighted return methodology, meaning daily percentage changes are weighted equally regardless of external cash inflows or withdrawals. You can benchmark multiple portfolios against major indexes like the S&P 500, highlight max drawdown periods, or compare returns directly against other portfolios, ETFs, or individual stocks.
Insight
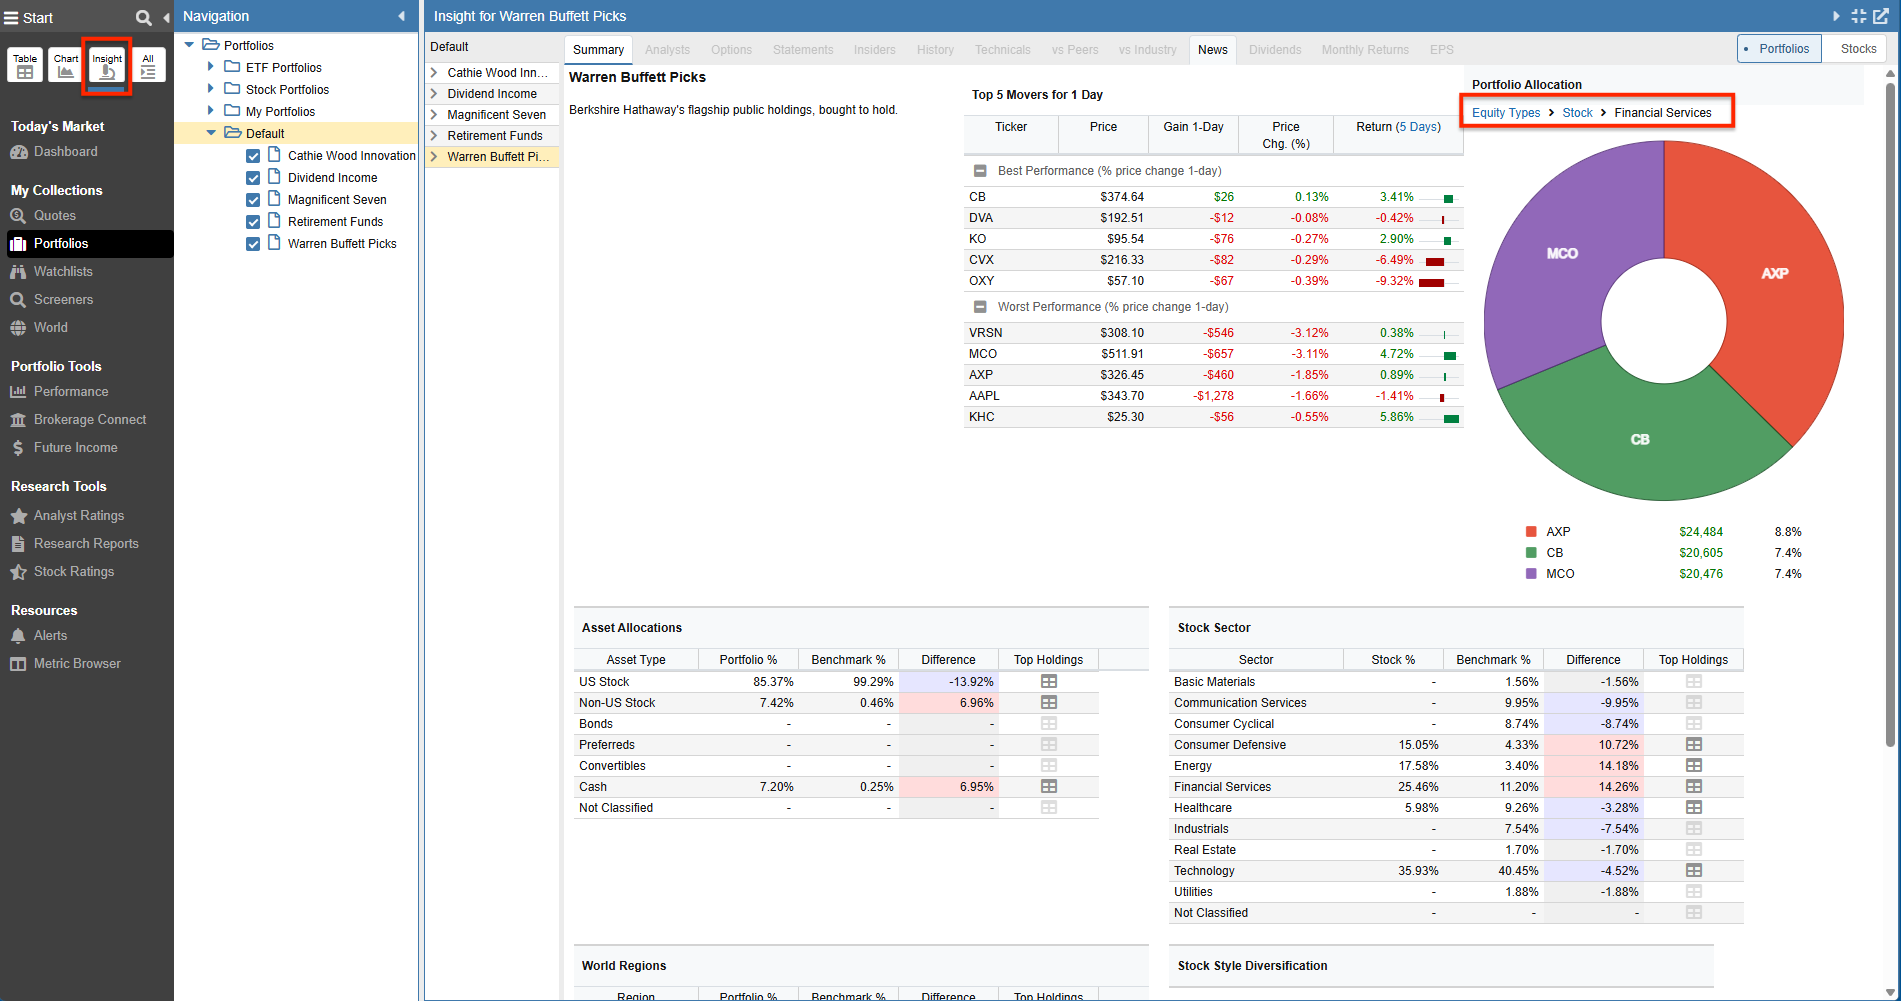
By opening the Summary tab in the Insight panel for your selected portfolio, you can view your top movers and an asset allocation pie chart. Clicking into any segment allows you to drill down into deeper layers (for example, clicking a stock allocation to reveal sector exposures, and clicking a sector to isolate your positions in that industry).
Portfolio Performance
Stock Rover’s Performance tools (found under Portfolio Tools in the Start Menu) leverage your complete trading history to deliver institutional-grade calculations for any time frame you select (including internal rate of return (IRR), time-weighted return (TWR), volatility, beta, and Sharpe ratio).
Performance tracking is organized into six dedicated tabs along the top of the tool:
- Report: The comprehensive Portfolio Performance Report (executive summary)
- Value Over Time: Historical balance and cash-flow tracking
- Risk and Reward: Quantitative risk, volatility, and benchmark correlations
- Holdings Detail: Position-by-position performance and contribution analysis
- Monthly Returns: Heatmap and bar chart breakdowns of historical monthly performance
- Yearly Returns: Annual performance charting of your portfolios versus benchmarks
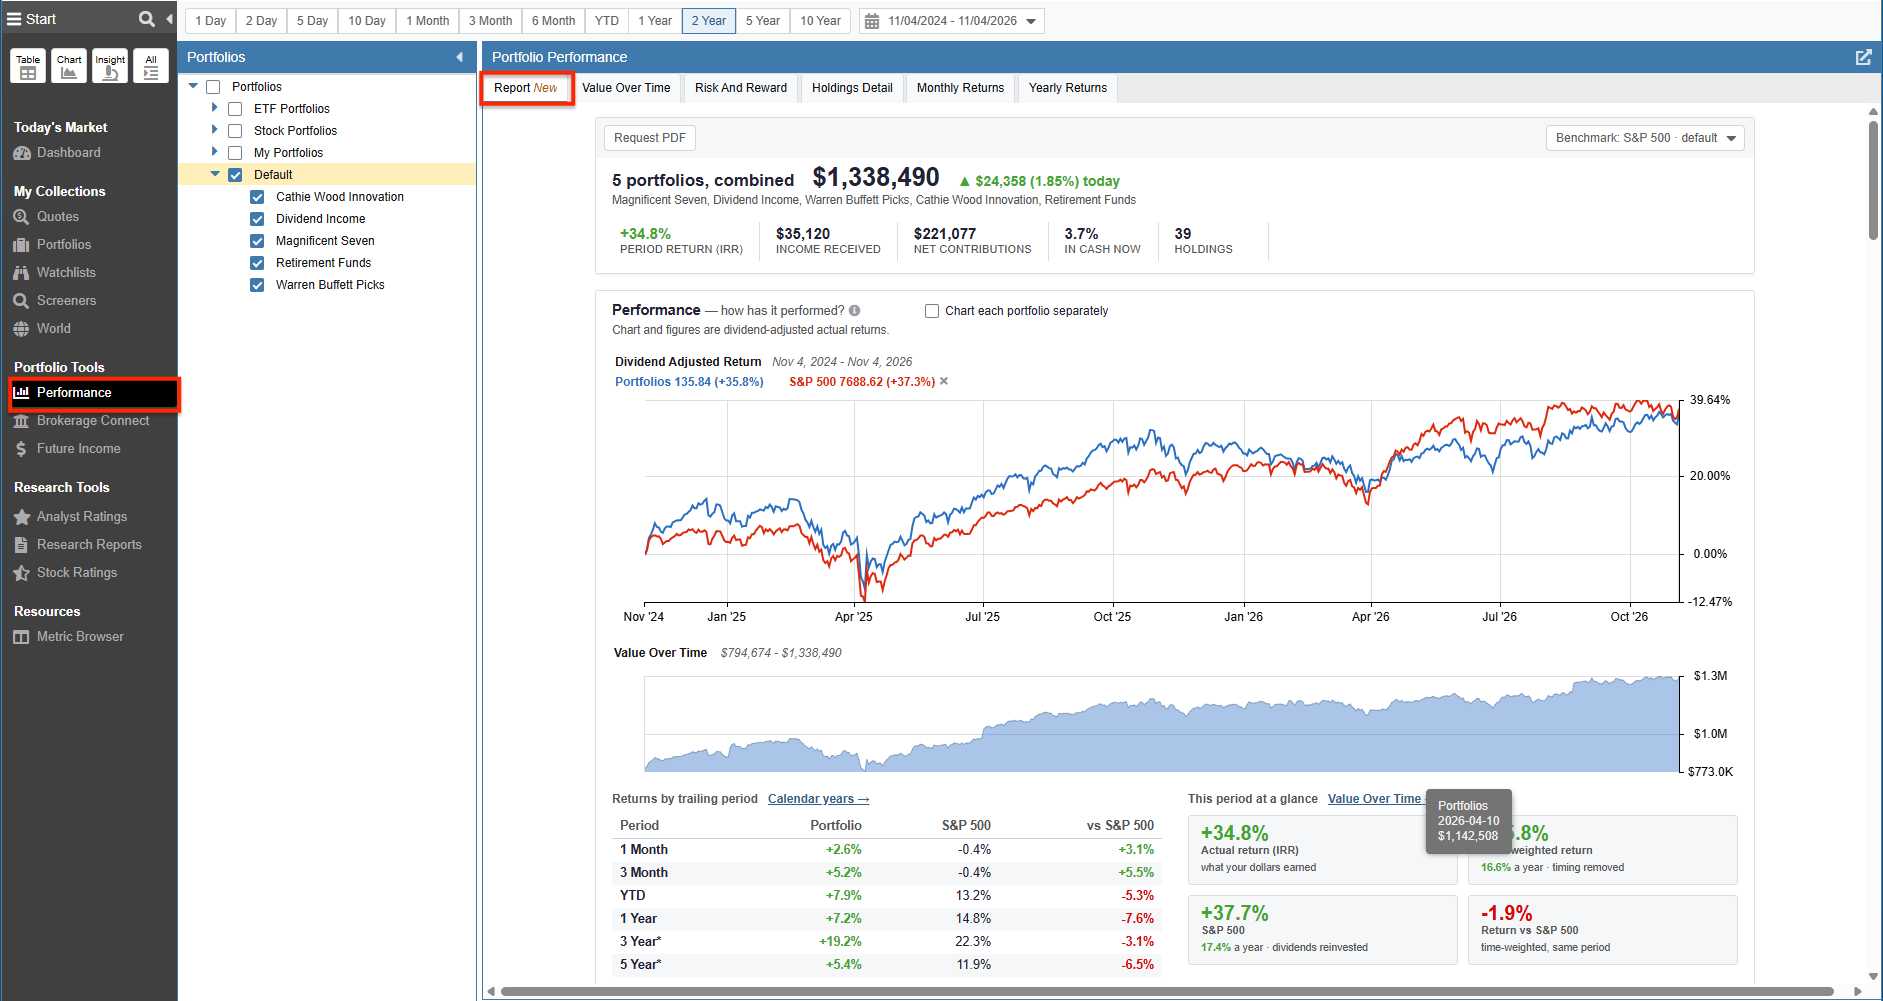
Navigation: Click Performance under Portfolio Tools to access these tabs.
The Portfolio Performance Report
The Performance Report acts as an executive summary for your investments. This vertically scrolling report pulls together the most vital metrics from across the platform into a cohesive story. You can run the report on an individual portfolio or aggregate multiple portfolios to assess your total net worth in one unified view.
Key sections of the Performance Report include:
- At-A-Glance Summary: Provides a top-line assessment of your portfolio’s health without scrolling, showing total value, today’s change, period return, income received, net contributions, cash percentage, and holding count. You can switch the comparison benchmark via a dropdown menu or click “Request PDF” for an exportable document.

The executive summary provides instant status metrics, benchmark switching, and PDF generation.
- Tracking Performance Over Time: Plots dividend-adjusted actual returns against your benchmark alongside a shaded area chart showing portfolio value over time. Highlights both your Period Rate of Return (IRR) (money-weighted personal return including cash flows) and Time-Weighted Return (TWR) (pure investment return without cash-flow distortion).
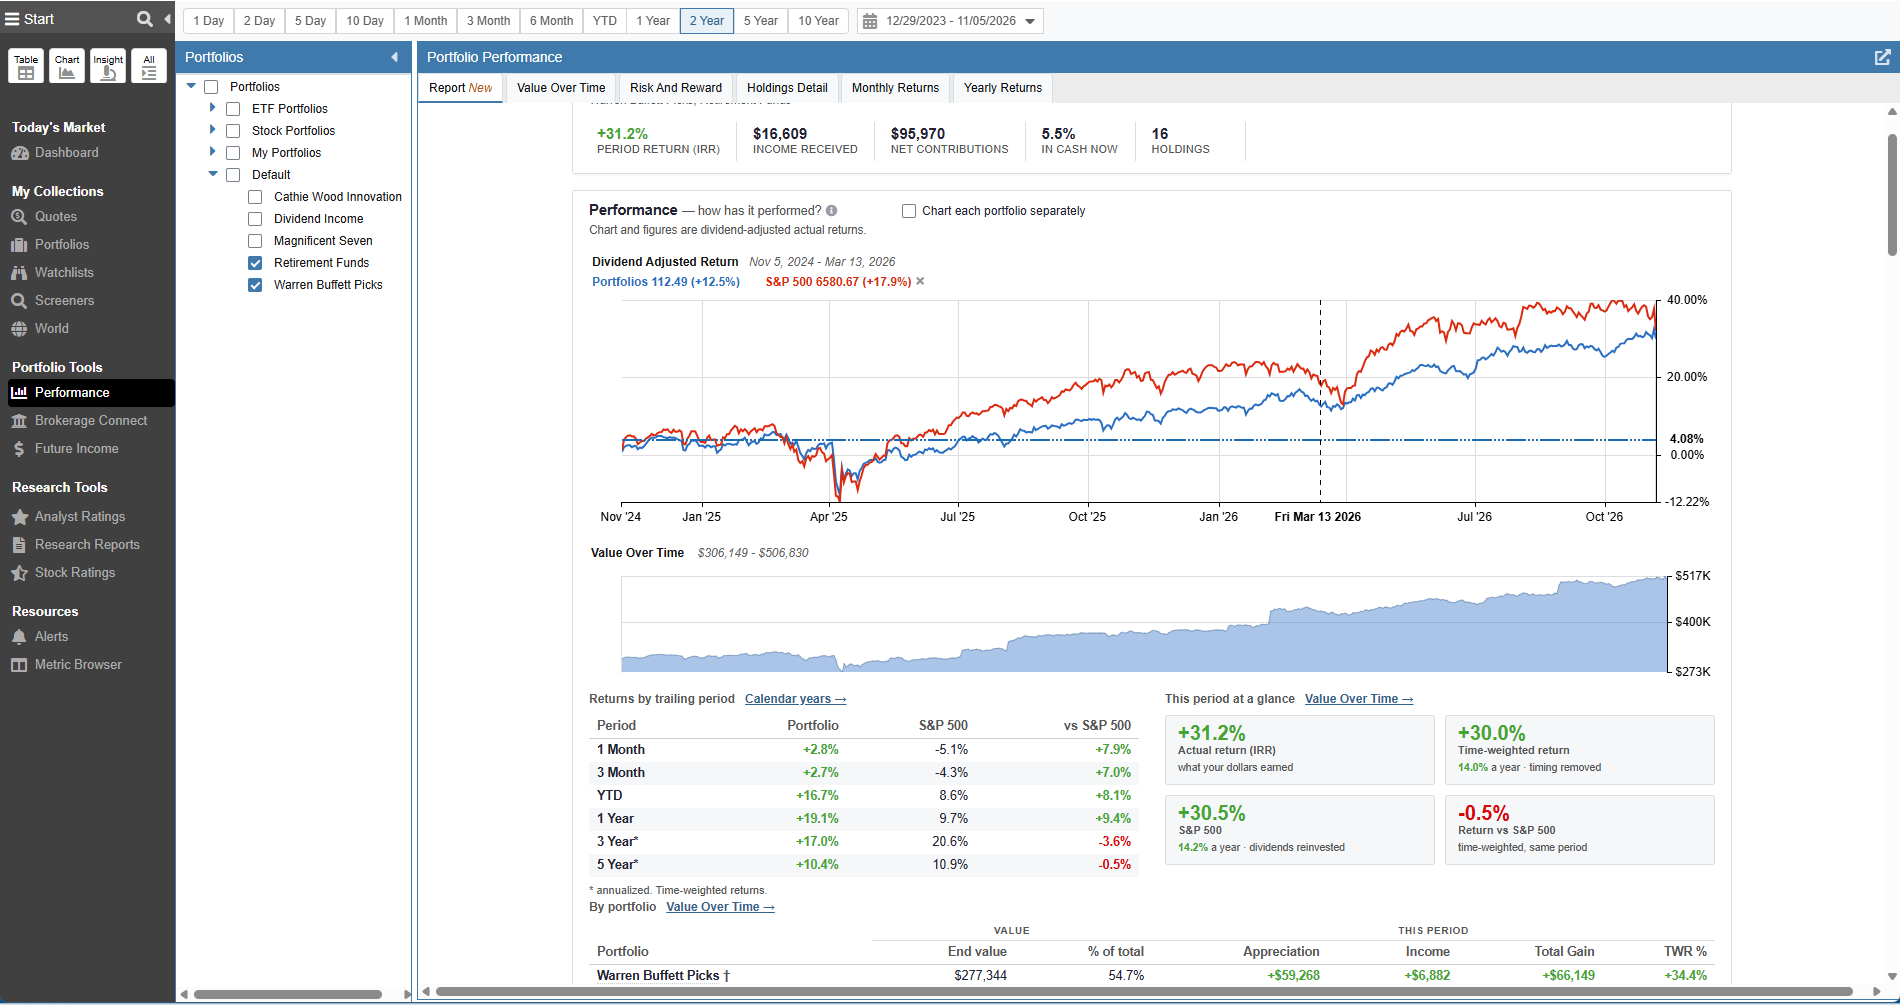
Compare dividend-adjusted returns and value trajectory side-by-side against the benchmark.
- Visualizing Wealth Creation: A visual waterfall chart decomposes changes in your balance into three distinct drivers: net capital added or withdrawn, market appreciation, and accrued dividends/income. An accompanying table separates market appreciation into realized and unrealized gains.
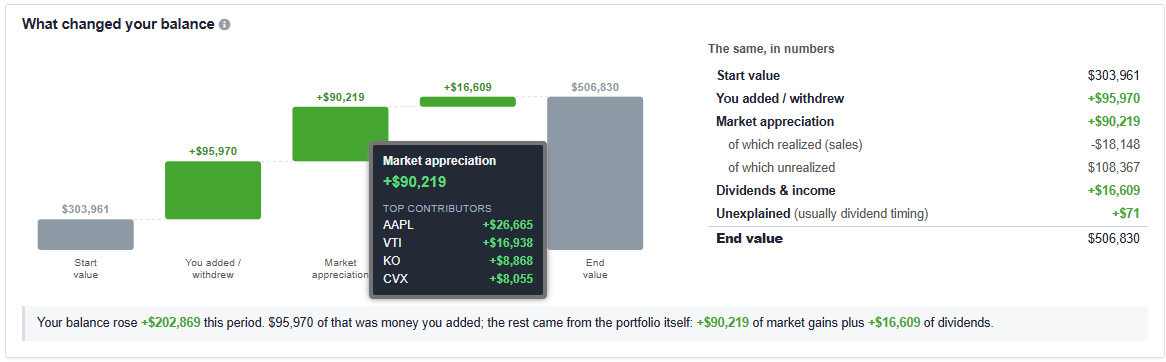
Waterfall charting clearly separates external savings from market-generated wealth.
- Two Honest Answers to “How Did I Do?”: Compares Actual History (evaluating what you owned each day, including trades and deposits) with Current Holdings (assuming current assets were held statically for the entire period) to evaluate whether your trading activity helped or hindered performance.
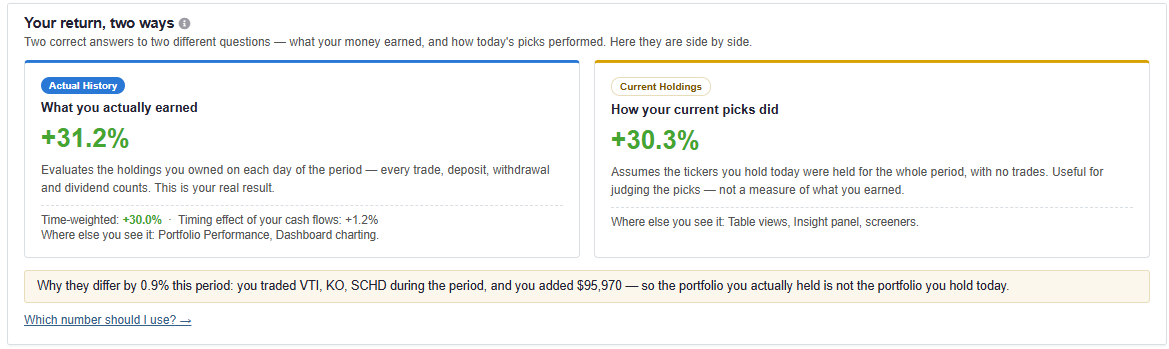
Side-by-side analysis of Actual History versus static Current Holdings.
- Portfolio Composition & Look-Through: Features an asset allocation donut chart, equity style box, geographic breakdown, and sector comparisons versus the S&P 500. For ETFs and mutual funds, the report looks completely under the hood into their underlying constituents. It also calculates your Effective number of holdings to assess true diversification.
- Contributors and Detractors: A horizontal bar chart identifying the exact dollar gain or drag each individual asset contributed over the period, including positions closed prior to the end of the period.
- Measuring True Risk: Provides quantitative metrics including Volatility, Beta, Max Drawdown, Sharpe Ratio, and Sortino Ratio alongside an interactive daily drawdown chart and a worst-declines recovery table.
- Cash Flow & Projected Income: Details historical dividends and annualized yields while modeling a 12-month forward-looking dividend cash-flow forecast based on announced payout schedules.
- Automated Portfolio Checkups: Automatically evaluates your holdings against core risk rules, flagging issues such as single-stock concentration (>15%), sector overexposure (>2x benchmark), cash drag, or high fund expense ratios.

Automated checkups alert you to concentration, sector skew, and cash drag.
Value Over Time
The Value Over Time tab tracks how the dollar value of your portfolios has progressed, detailing inflows, outflows, and underlying asset price changes.
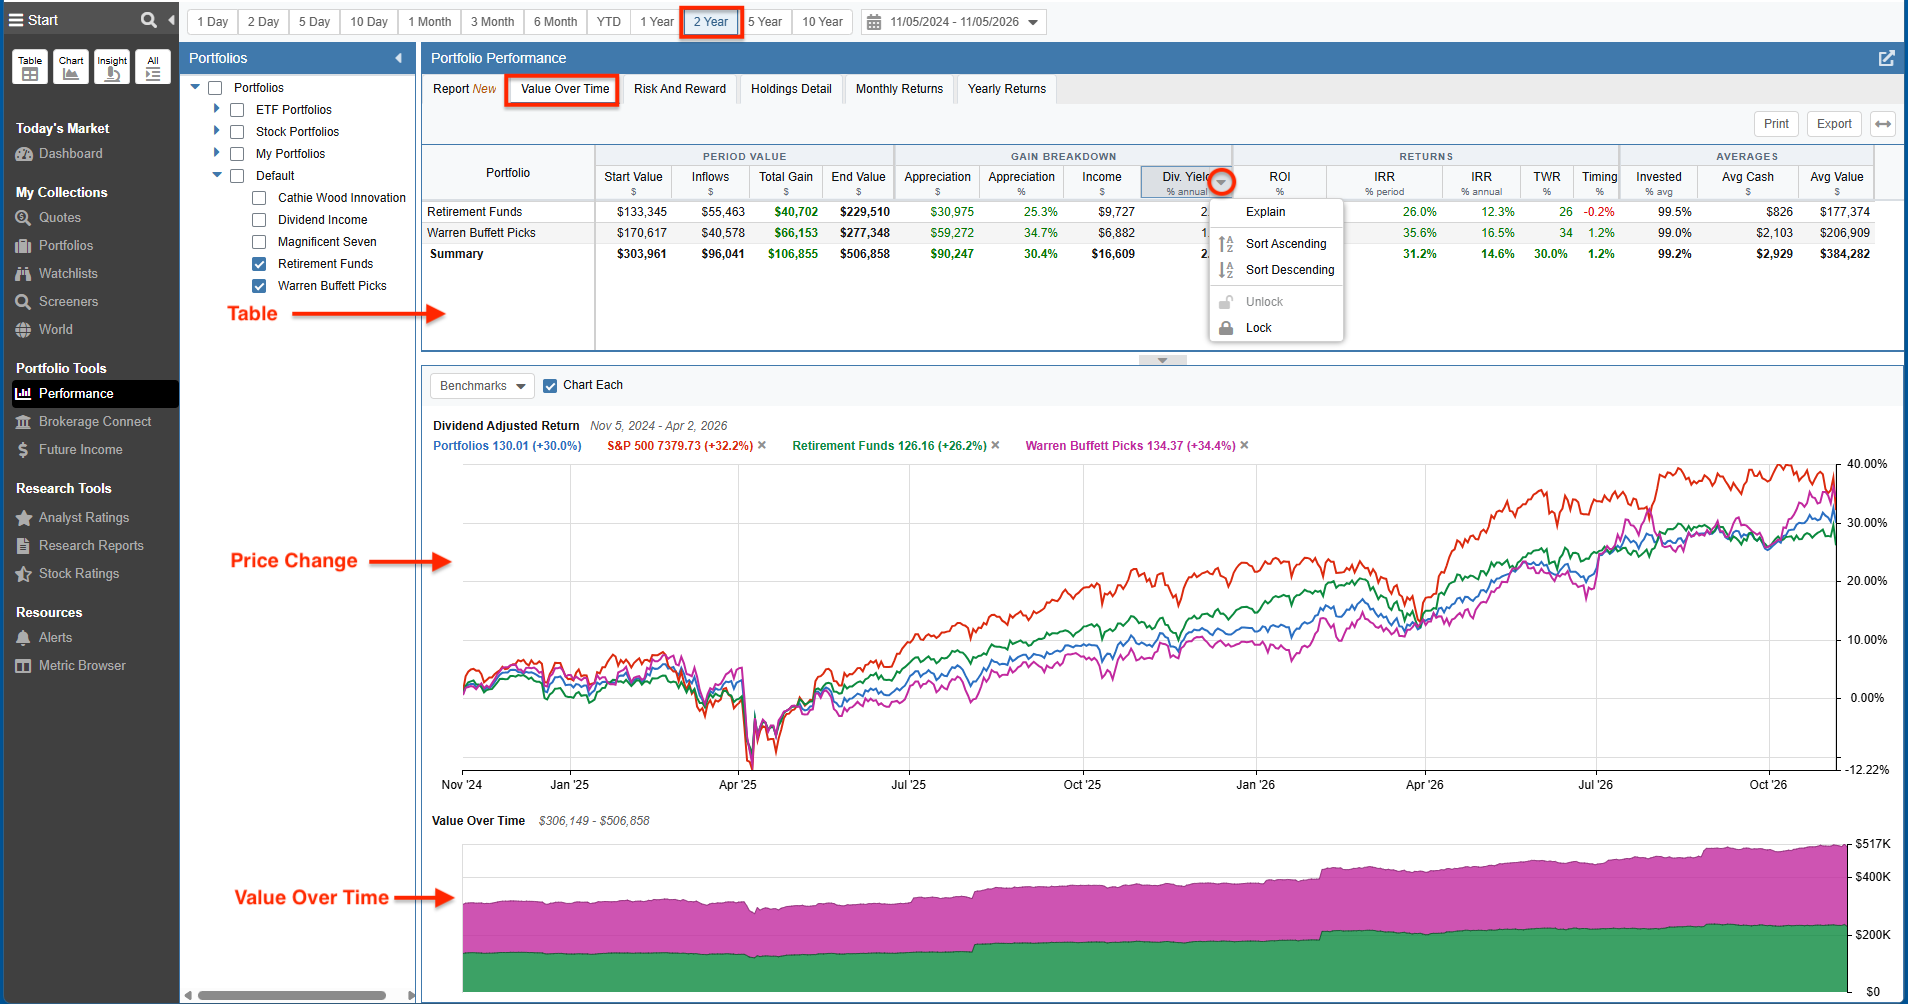
The Table displays portfolio value metrics over the selected timeframe, including the start and end values, inflows, absolute dollar gain, and your personal rate of return (both IRR and TWR).
The Price Change visual charts the value-weighted average daily price changes of your portfolios, either combined into a single plot or broken out individually, with benchmark overlays available.
The Value Over Time Chart maps the combined total dollar balance of your accounts over time, featuring interactive tooltips that show your precise portfolio worth on any historical date.
Risk and Reward
The Risk and Reward tab analyzes the level of risk incurred to generate your returns, benchmarking your portfolios’ volatility against the broader market.
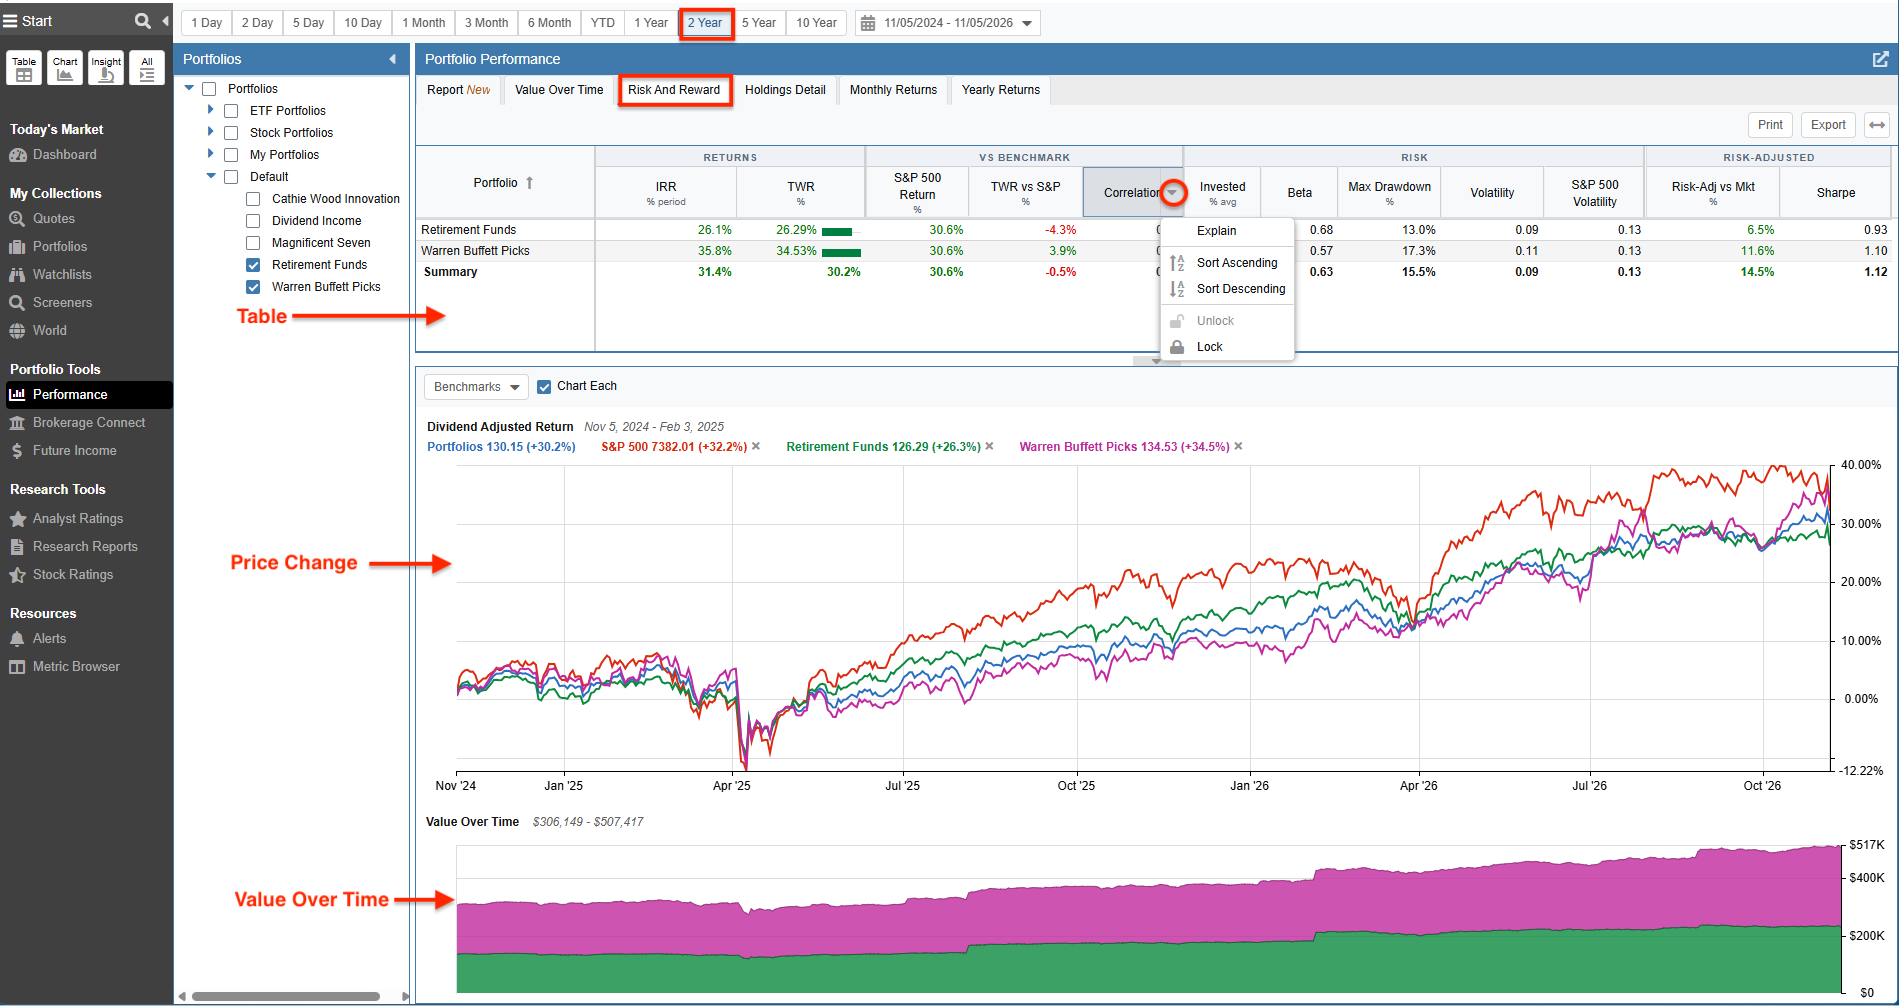
The Table provides configurable metrics such as your personal rate of return, S&P 500 correlation, Beta, maximum drawdown, and Sharpe ratio.
Interactive Price Change & Value Over Time Charts map daily price movement and total portfolio equity alongside your chosen benchmark over time.
Holdings Detail
The Holdings Detail tab breaks down the return contribution of every holding held during the period, ensuring that closed positions are fully represented alongside existing ones. You can view your data across different levels of detail using the Simple, Standard, Detailed, and Custom layout presets. For more information on these views, please see our Upgrades to Portfolio Performance post.
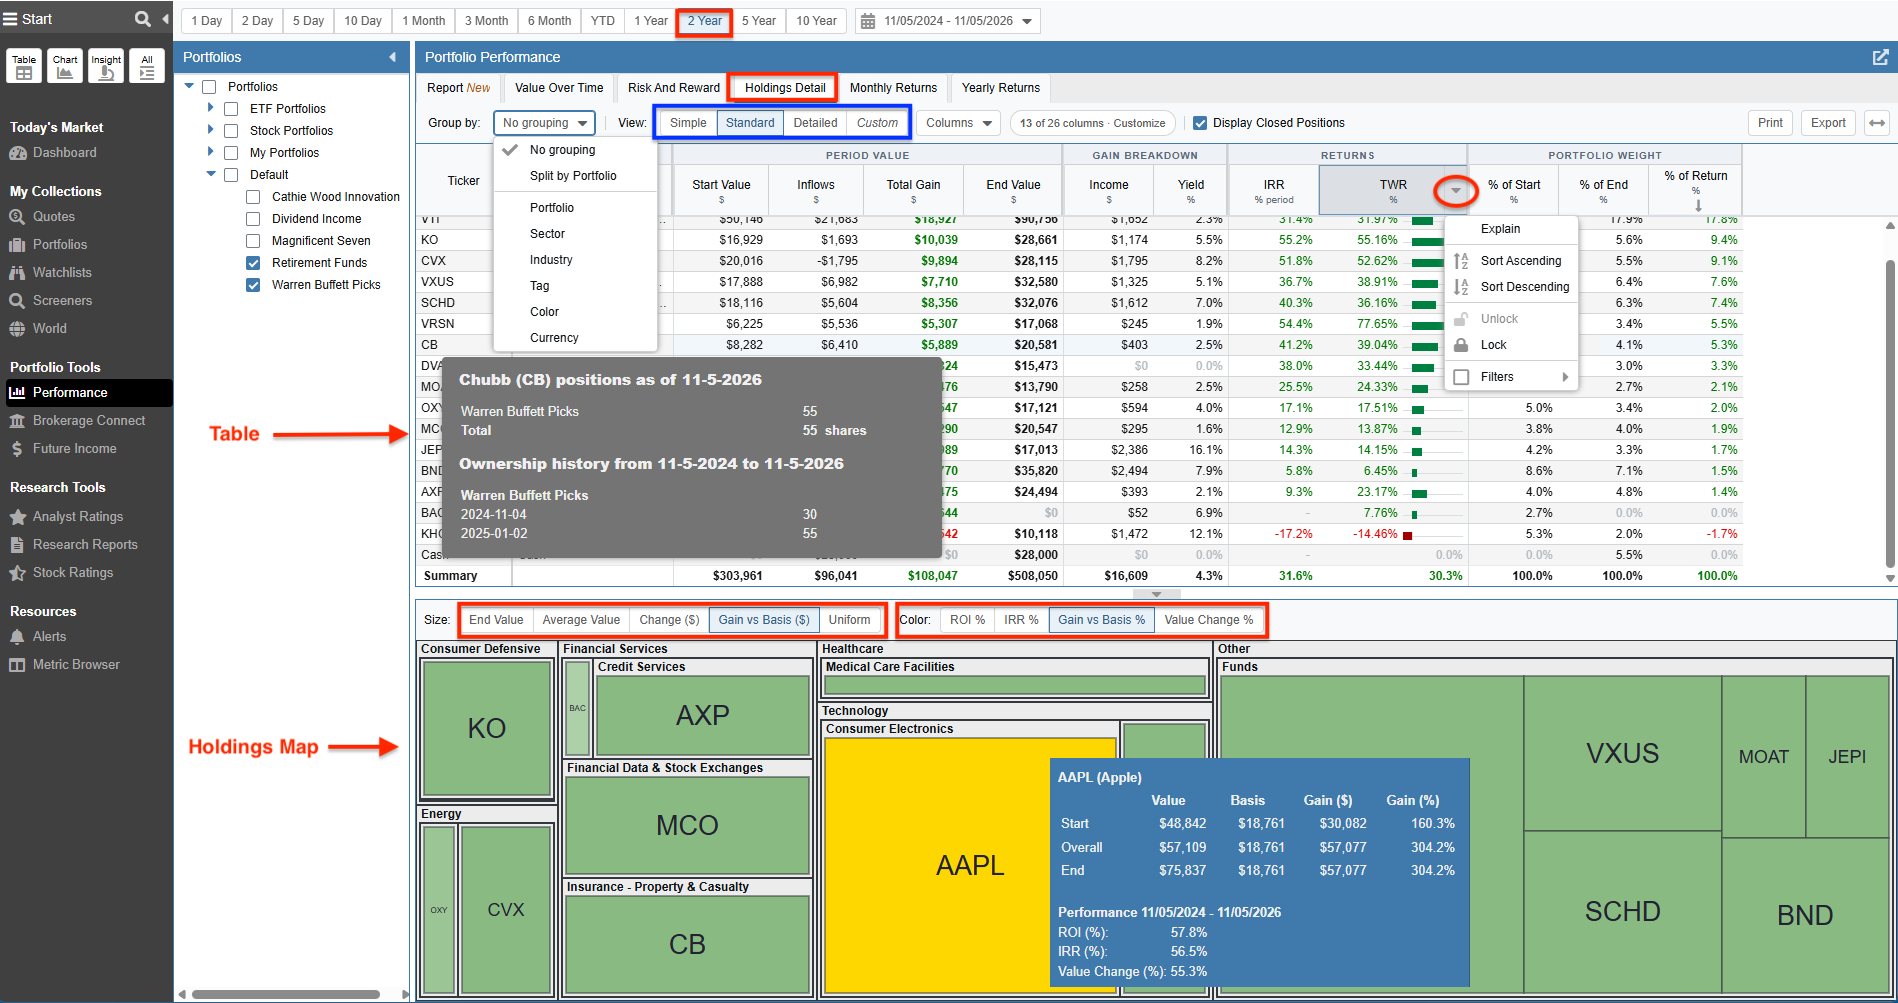
The Table lets you group and sort positions by attributes like portfolio, sector, industry, or tag, detailing total gain, income, and individual asset performance (including IRR and TWR) for the selected period.
The Holdings Map integrates a heat map that visually groups your holdings. Tile sizing and coloring can be configured to reflect metrics such as total dollar change or overall ROI %.
Monthly Returns
The Monthly Returns tab breaks down your portfolio’s performance month-by-month. You can select your calculation methodology (choosing between Time-weighted or Money-weighted (IRR) returns) and view the data represented as either a heat map or a bar chart, alongside tabular data. You can also chart these returns directly against a selected benchmark.
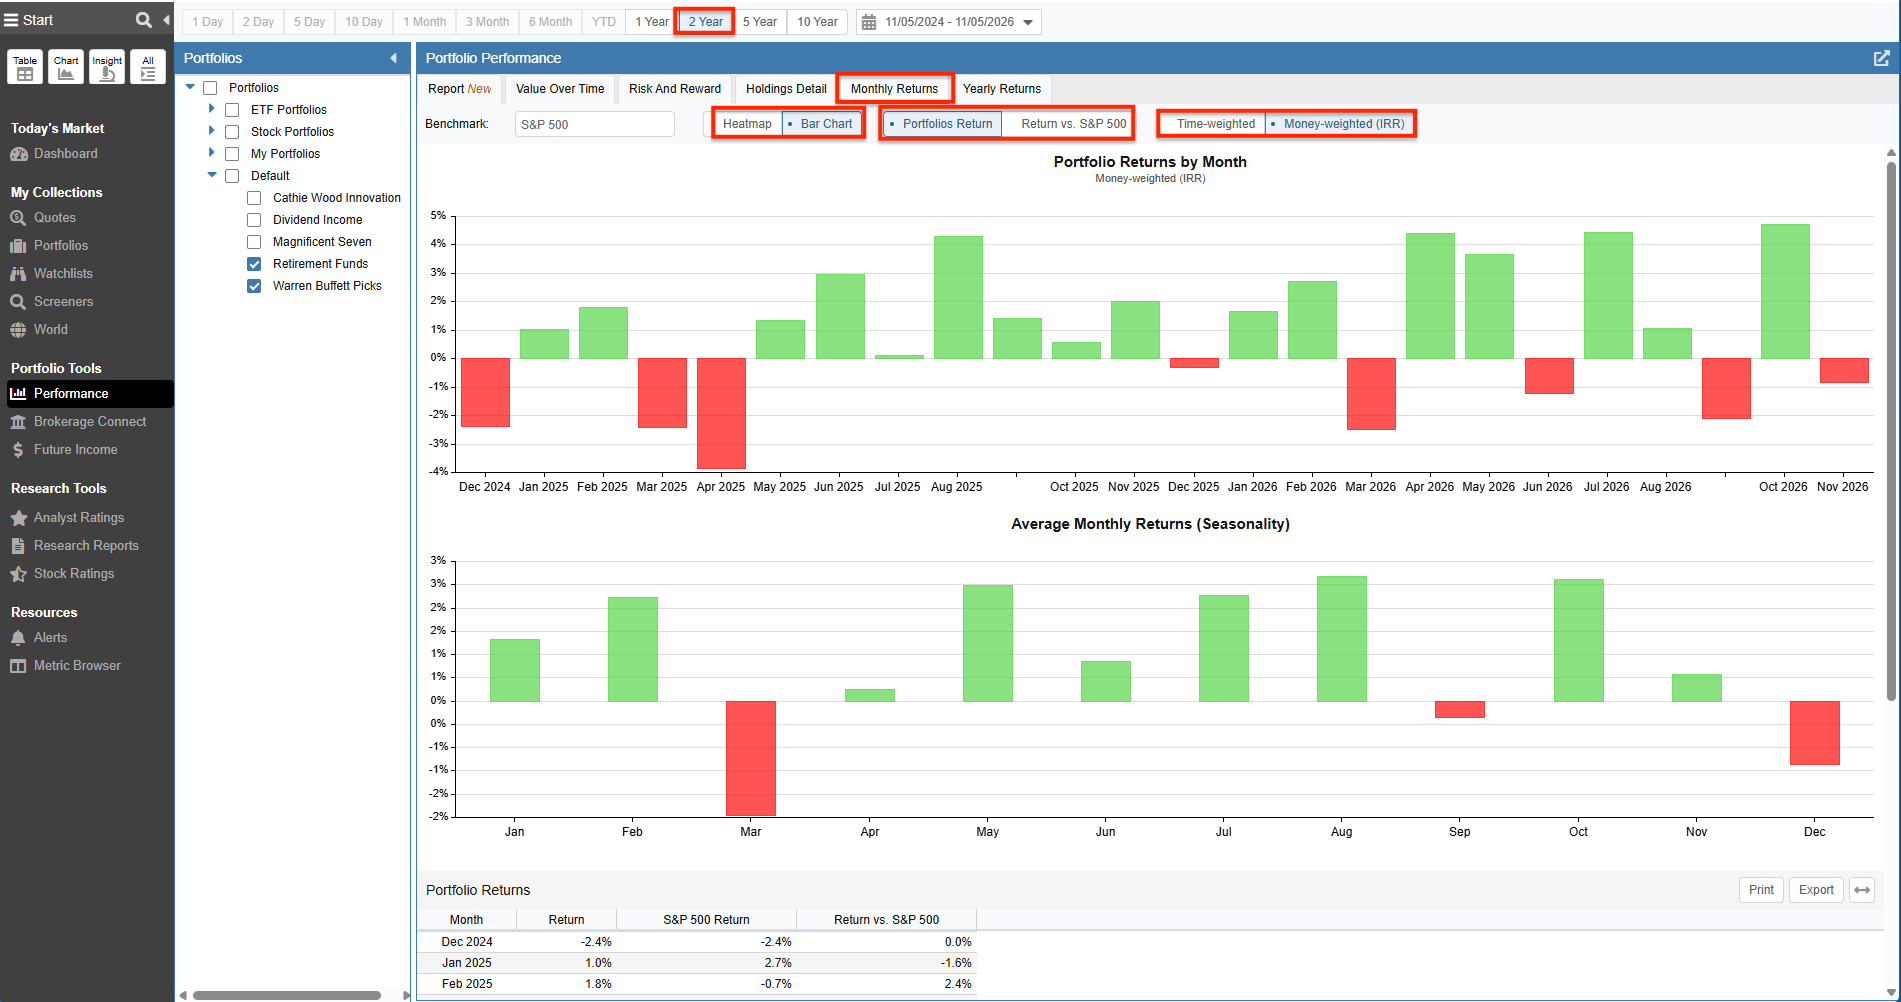
Toggle between Heatmap and Bar Chart views to analyze monthly seasonality and return spread.
Yearly Returns
The Yearly Returns tab provides an annual summary of your portfolios against your selected benchmark. Like the Monthly Returns tab, you can toggle your return methodology and view a clear bar chart and corresponding table detailing your yearly performance.
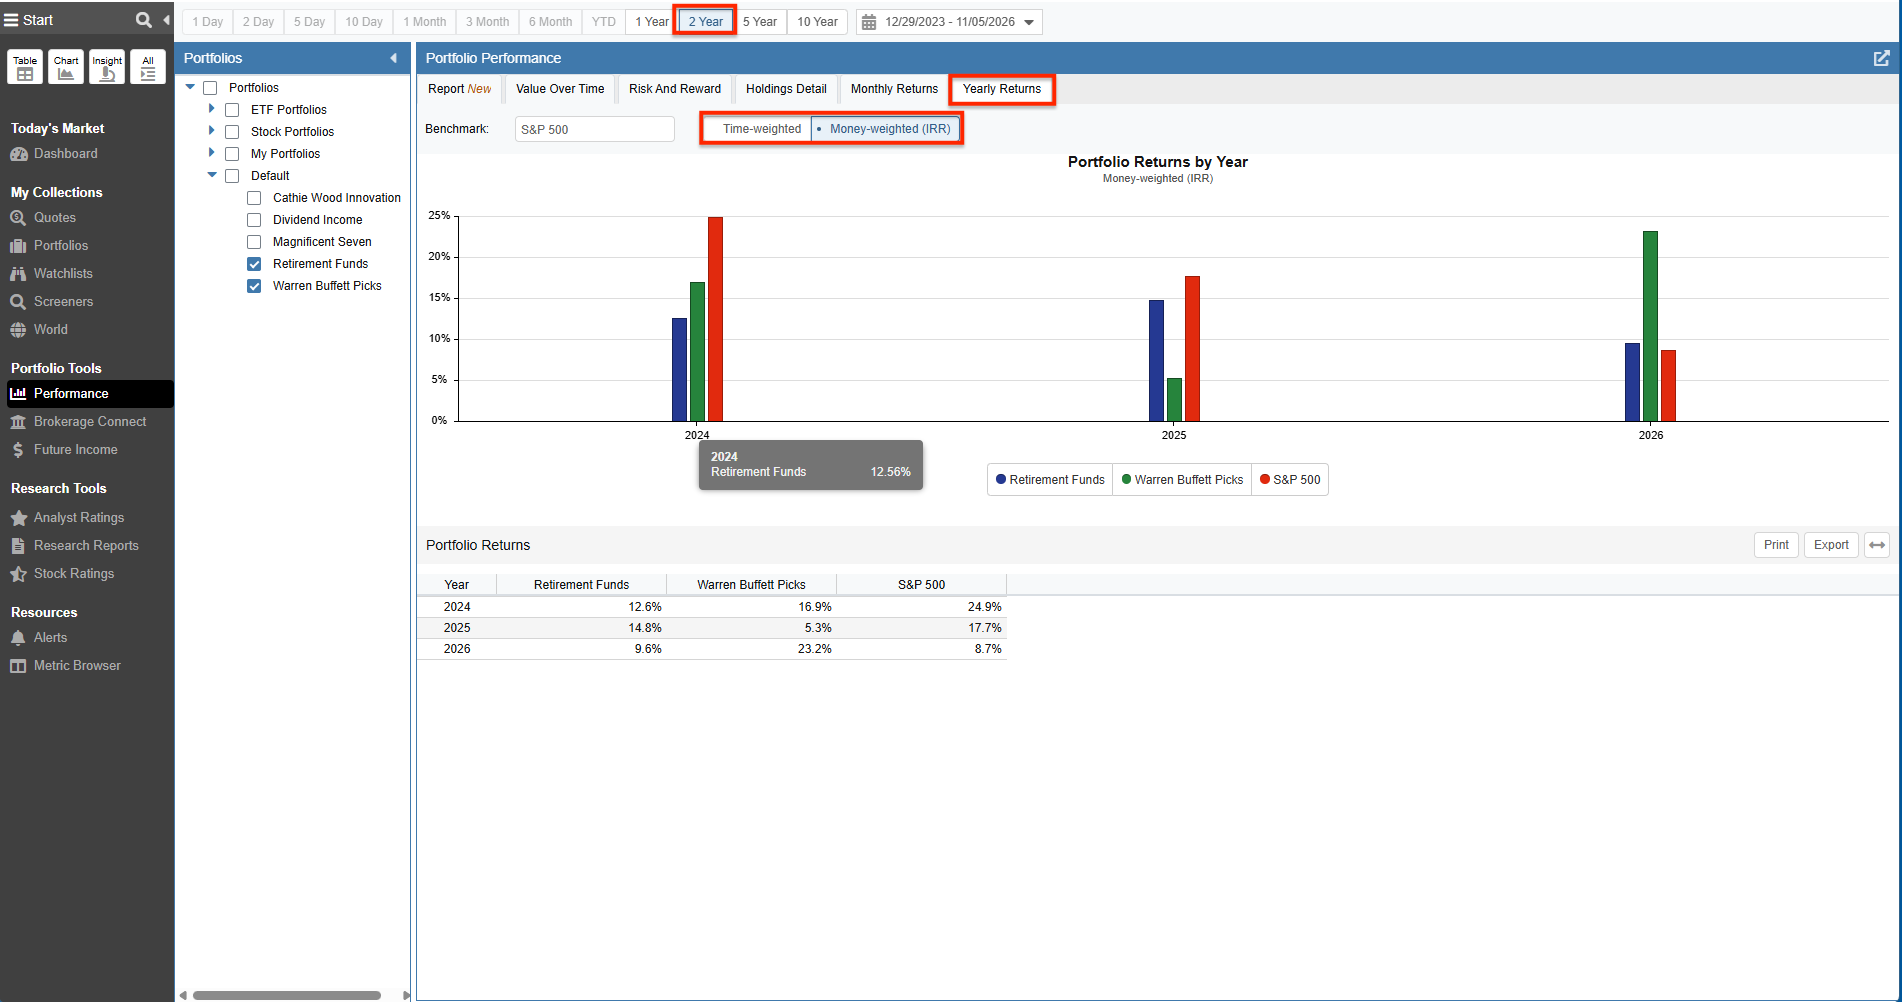
Compare multi-year performance across portfolios against your benchmark index.
Email Portfolio Performance
While the tools above are perfect for active, hands-on analysis, Stock Rover also allows you to track your portfolios passively. You can configure your email preferences to receive automated portfolio performance digests on a daily, weekly, or monthly schedule.
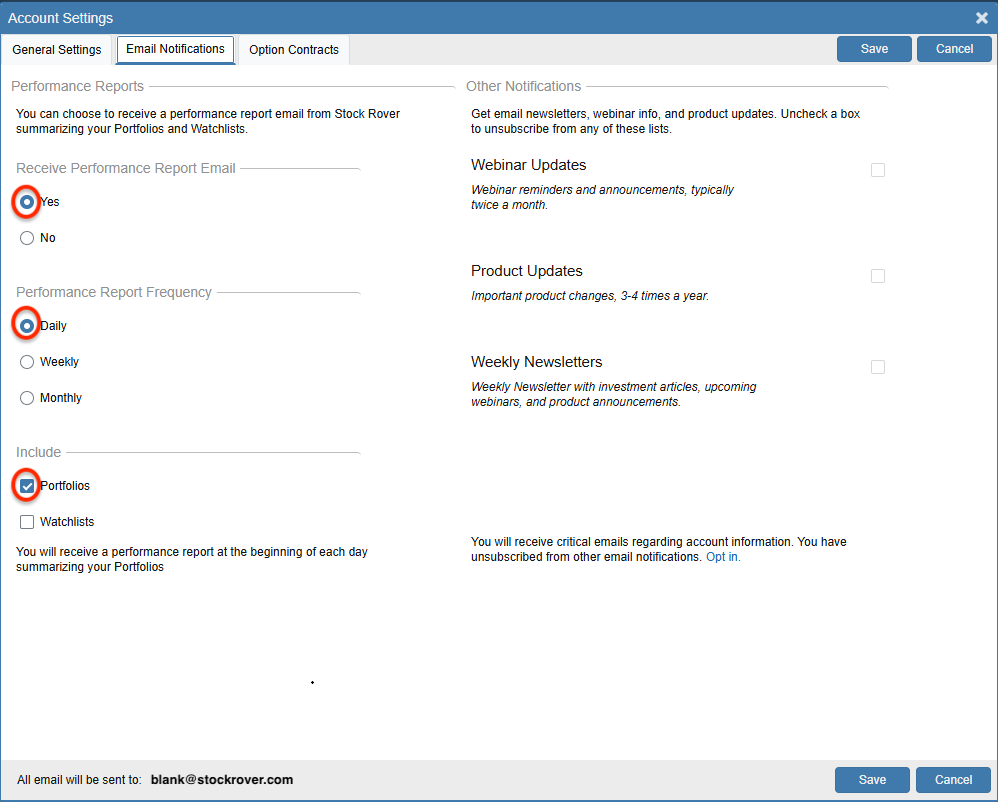
These reports summarize your overall portfolio balances, provide multi-period performance comparisons (1-Week, 1-Month, 3-Month, YTD, and 1-Year), and highlight your top portfolio movers.
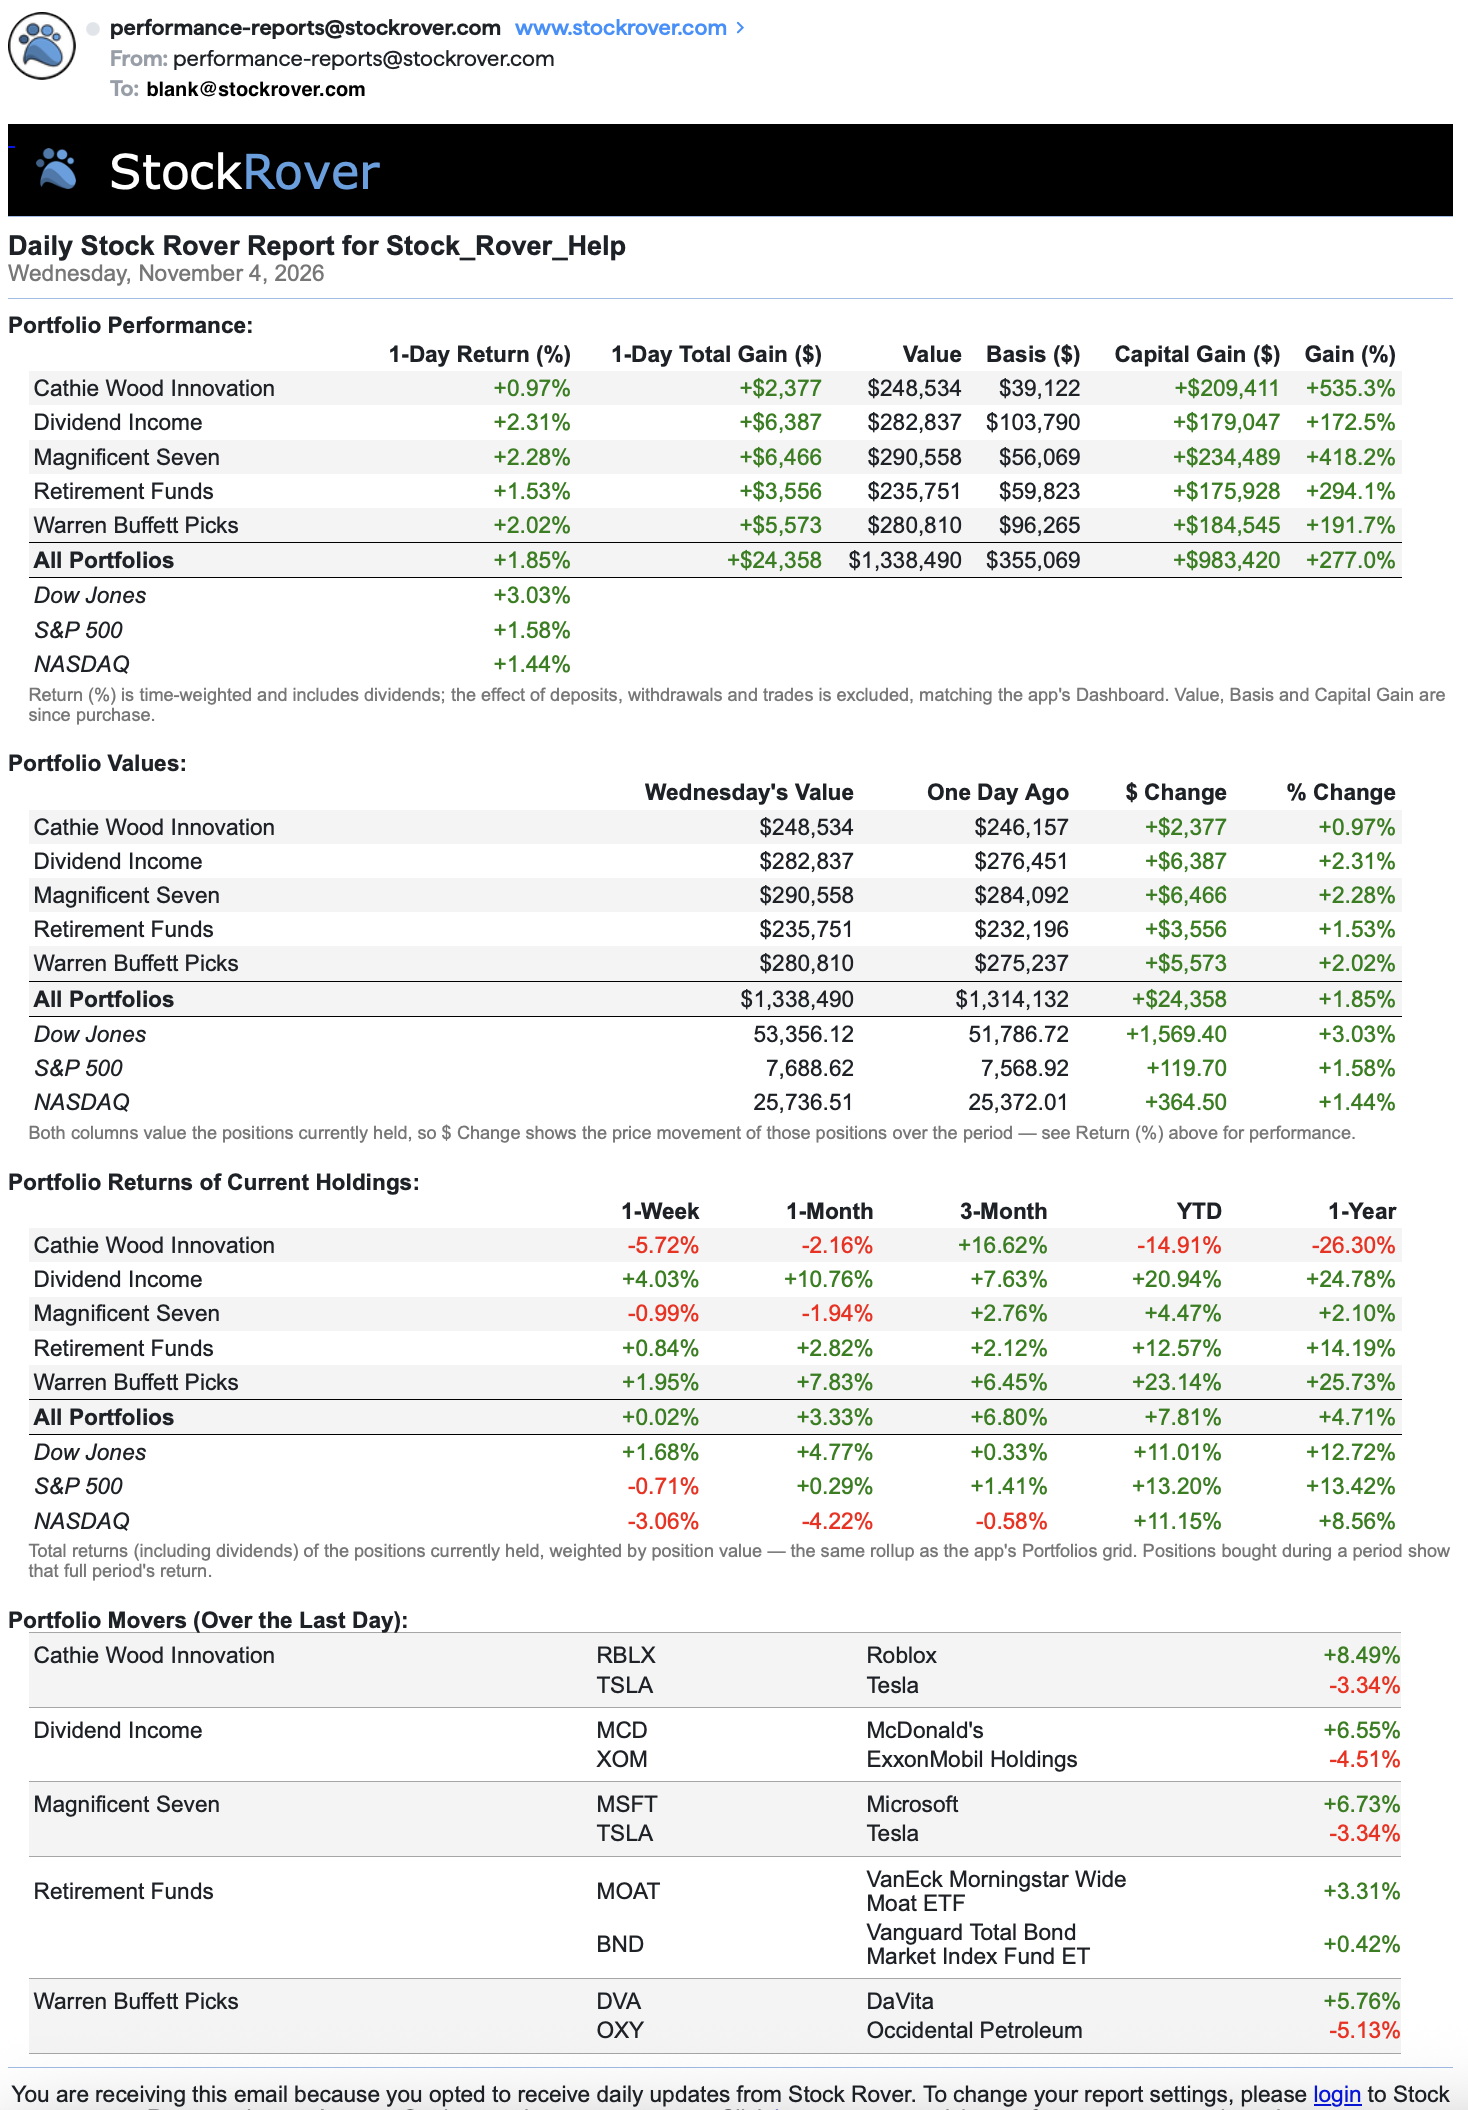
Alerting
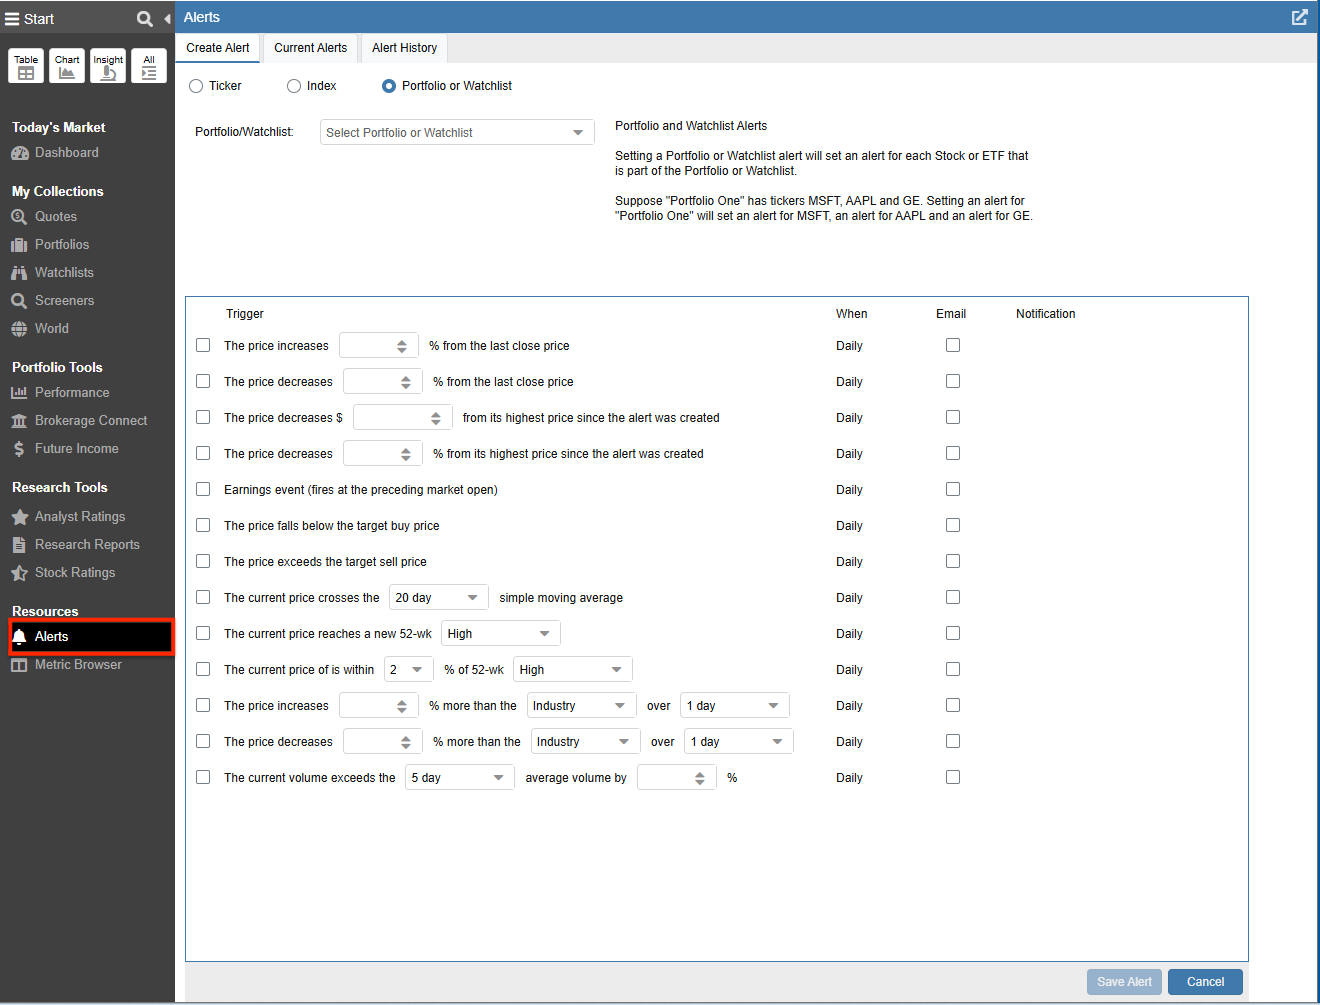
Stock Rover’s Alerts Facility delivers automated email alerts when critical events occur across your portfolio holdings. You can configure notifications for threshold price targets, 52-week highs and lows, unusual trading volume, upcoming earnings dates, moving-average crossovers, or sudden industry-relative performance deviations.
Summary
Disciplined portfolio tracking is essential to ensure your investments remain aligned with your financial goals and to identify positions that are failing to pull their weight. Stock Rover delivers multiple layers of tracking tools to support your workflow:
- The Dashboard provides an immediate overview of portfolio returns, unified holdings views, asset allocation, and real-time triggers.
- The Deep Research Tools (Table, Chart, Insight) provide granular research capabilities for in-depth comparative analysis.
- The Portfolio Performance suite delivers a multi-dimensional view of your investments, from the executive Performance Report and Value Over Time to quantitative Risk and Reward metrics, granular Holdings Detail, and periodic breakdowns via Monthly Returns and Yearly Returns.
- Automated Email Reports and Alerts ensure that critical portfolio events and performance updates reach you automatically without requiring manual review.
Frequently Asked Questions
What is the Portfolio Performance Report?
The Performance Report is an executive summary tab located under Portfolio Tools > Performance. It synthesizes your portfolio data into a single, vertically scrolling report featuring high-level health metrics, dividend-adjusted benchmark tracking, wealth-creation waterfall charts, look-through ETF composition, risk metrics, income forecasts, and automated checkup warnings.
What is the difference between the Dashboard and Portfolio Performance?
The Dashboard serves as your daily home base for high-level monitoring, giving you an immediate view of overall portfolio value, recent gains, asset allocations, and key signals. The Portfolio Performance suite provides comprehensive, multi-tab historical analytics, including deep risk and volatility metrics, historical value over time, look-through holdings details, and the executive Performance Report.
Does the Stock Rover Table account for past trades?
No. The Table view is a “moment-in-time” display. It shows the performance of your current holdings based on purchase price vs. current price. To analyze performance that includes the impact of buy/sell trades over time, you should use Portfolio Charting or the Portfolio Performance suite.
What is the difference between Time-Weighted Return (TWR) and IRR?
Time-Weighted Return measures the performance of the underlying investments, ignoring the timing of your cash inflows and outflows. IRR (Internal Rate of Return), also known as your personal rate of return, accounts for the timing of your deposits and withdrawals. Stock Rover provides both metrics throughout the Portfolio Performance suite.
Can I track portfolios from multiple brokerages?
Yes. Stock Rover allows you to link multiple brokerage accounts via Brokerage Connect, powered by Yodlee integration. You can also create and maintain portfolios manually. Regardless of how they are entered, you can view your portfolios individually or aggregate them together in the Dashboard and Portfolio Performance suite to get a holistic view of your Net Worth.
Editor’s Note: This post was originally published in December 2022 and has been updated for freshness, accuracy, and comprehensiveness.
Comments
Leave a Reply
Top
Hi, I would love to buy stockrover subscription and move from away M*. The one thing that’s bothering me is- when I sell a stock and enter that trade in your portfolio as “Sell” it doesn’t allow me to specify price I sold the stocks at. It does allow me to specify price when I Buy stock, but not when i sell. This makes my entries inaccurate for managing portfolio. Is there a reason why it’s setup that way? I am happy to provide a screenshot to explain my question.
It is setup this way because we use Yodlee for brokerage integration and they only provide end of day positional data, not individual transactions. So the Stock Rover software is set up to deal with the data in the form Yodlee provides it.
We understand the frustration of not being able to enter exact sell prices and next year we expect to provide an alternate approach for portfolios that don’t integrate with Yodlee.
My comment disappeared. Maybe you are not interested in feedback.
Comments are reviewed by a human before they are posted on-line which can create a delay between posting them and seeing them.
I have enjoyed your service in the past and am currently not a user. However, I would like to rejoin, but need to know if you have added the ability to track preferred stock and baby bonds?
You can screen and track preferred stocks, but bonds would need to be tracked as assets.
tried to enroll, did not receive start up Email. John Snader, snaj58@gmail.com
new sign up says email all ready used. I’m stuck!
We have authenticated your account. Sorry for the difficulty.
It does not appear that the value summary provides an accurate total in the default or selected currency when I have holdings/portfolios in different currencies. So for example if I have 2 portfolios one USD and the other CAD, the total does not convert into a single currency. Am I missing something in the setup or configuration?
Hello,
The Value over Time tab in the Portfolio analytics does not convert currency.
The link below references a blog that shows how Stock Rover displays mixed currencies and demonstrate ways to effectively leverage the platform for multi-currency research and analytics.
https://www.stockrover.com/blog/product-features/currency-conversion-in-stock-rover/
Regards
Ken
As a very active trader of covered calls and cash secured puts, I have created spreadsheets for tracking those trades by the month going back about 16 years.
More people are trading options these days. Does StockRover have any plans to serve options traders?
It is on our futures list to address as we are fully aware the area is important to many investors.
Outstanding. Thank you.