

The Liberated Stock Trader Beat the Market Screener
July 1, 2020
Barry D. Moore
 Printer Friendly
Printer Friendly
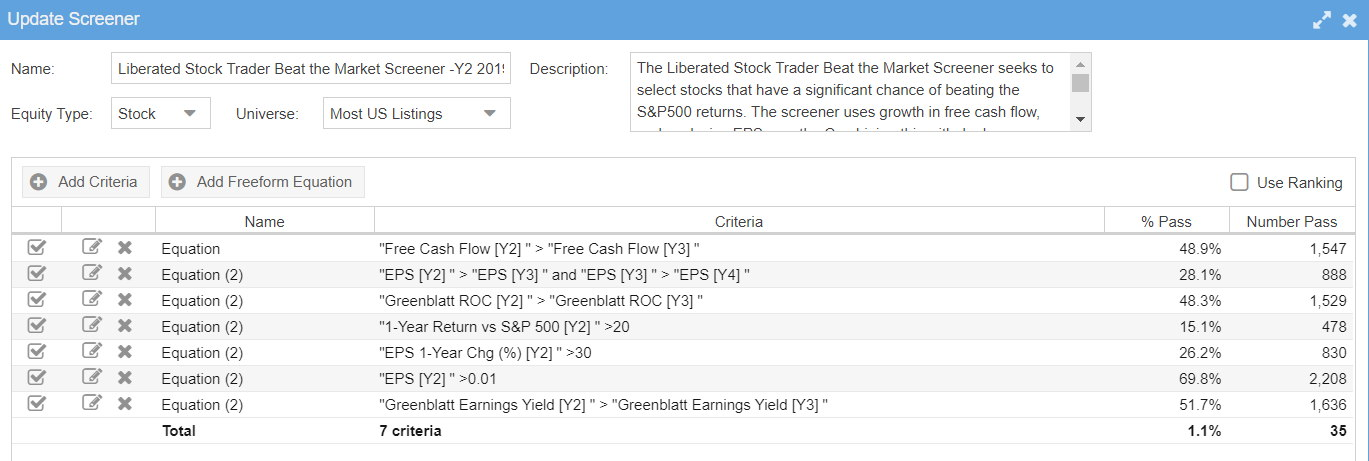
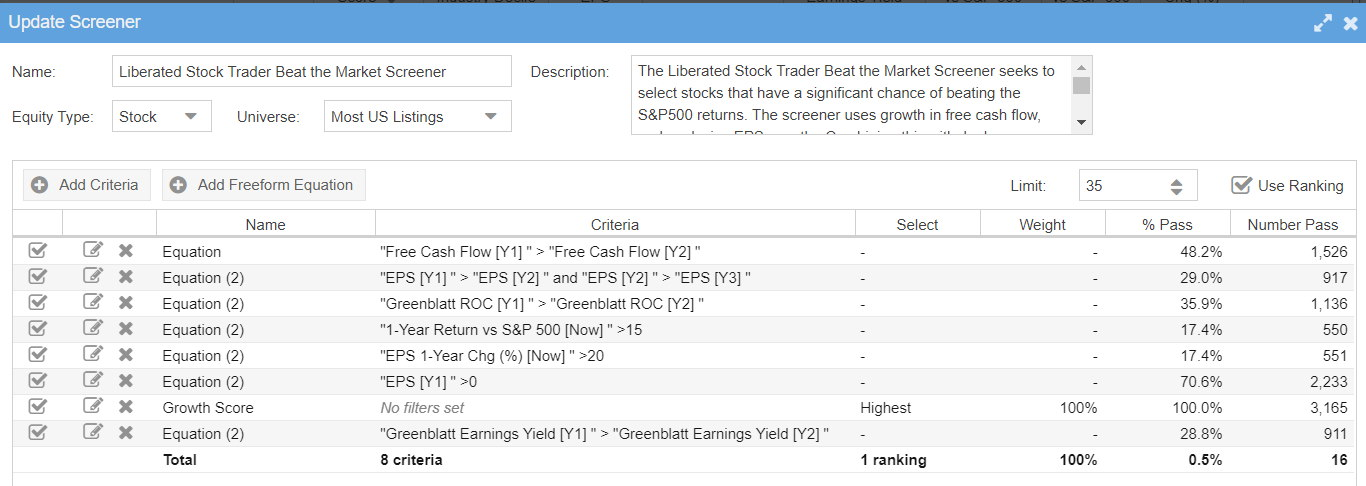
The Liberated Stock Trader Beat the Market Screener seeks to select stocks that have a significant chance of beating the S&P500 returns. The screener uses growth in free cash flow, and explosive EPS growth. Combining this with Joel Greenblatt’s ROC and Earnings Yield formulas “the Magic Formula” we have a selection of stock that beat the market 5 of the last 7 years.
The Screener is available for download in the Stock Rover’s Investor Library. Further details on the backtesting at www.liberatedstocktrader.com/lst-beat-the-market-screener.
Results
| S&P 500 | $100,000 | LST BTM | $100,000 | |
|---|---|---|---|---|
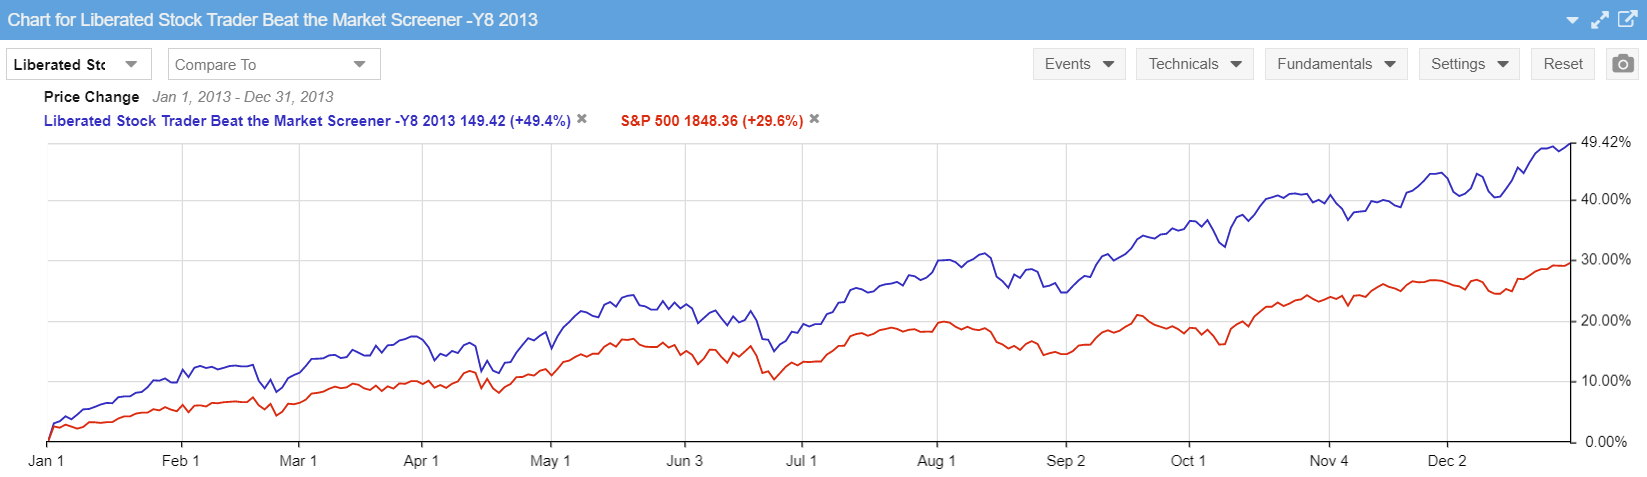
| 2013 | 1.30 | $129,800.00 | 1.49 | $149,400.00 |
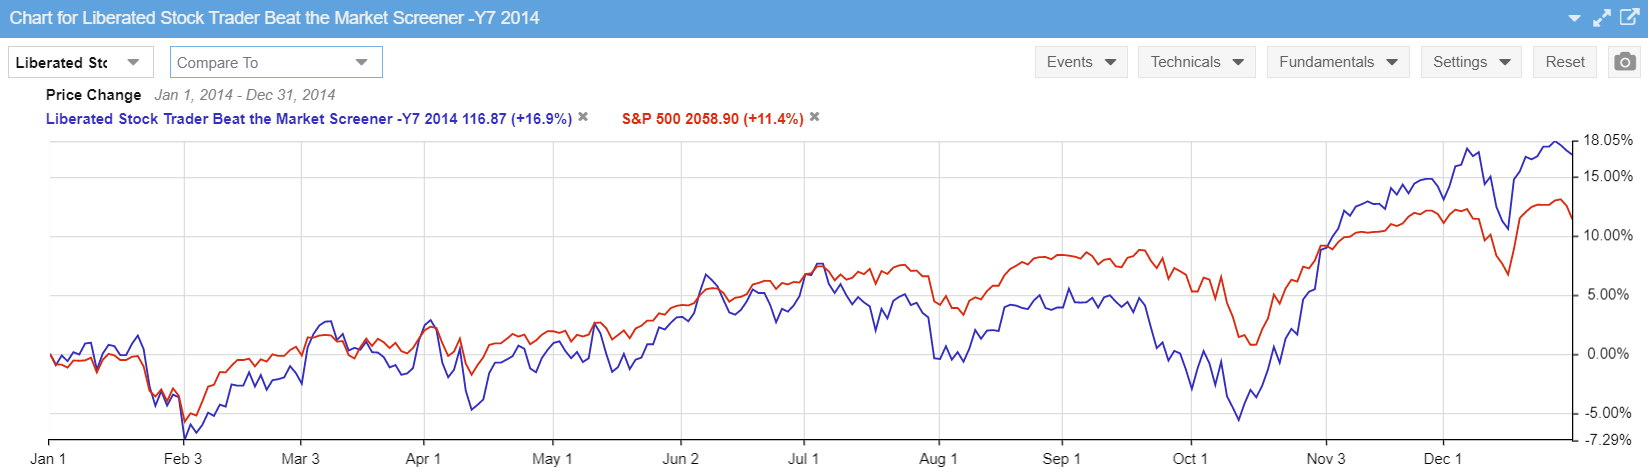
| 2014 | 1.11 | $144,597.20 | 1.17 | $174,648.60 |
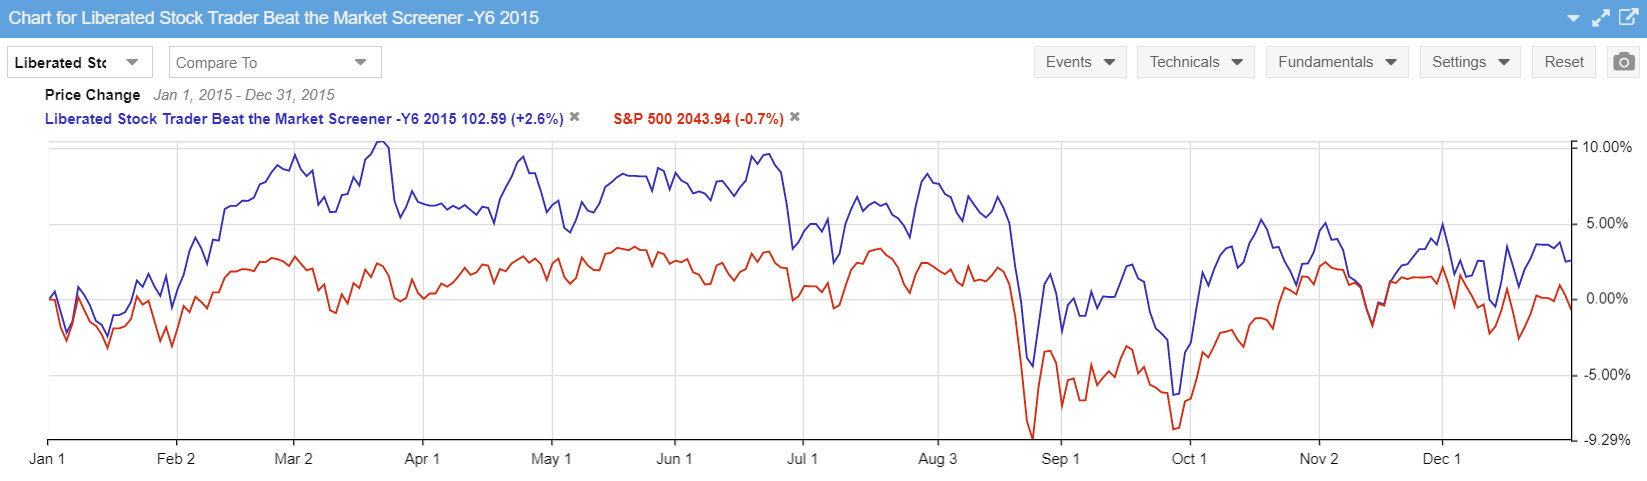
| 2015 | 0.93 | $134,475.40 | 1.03 | $179,189.46 |
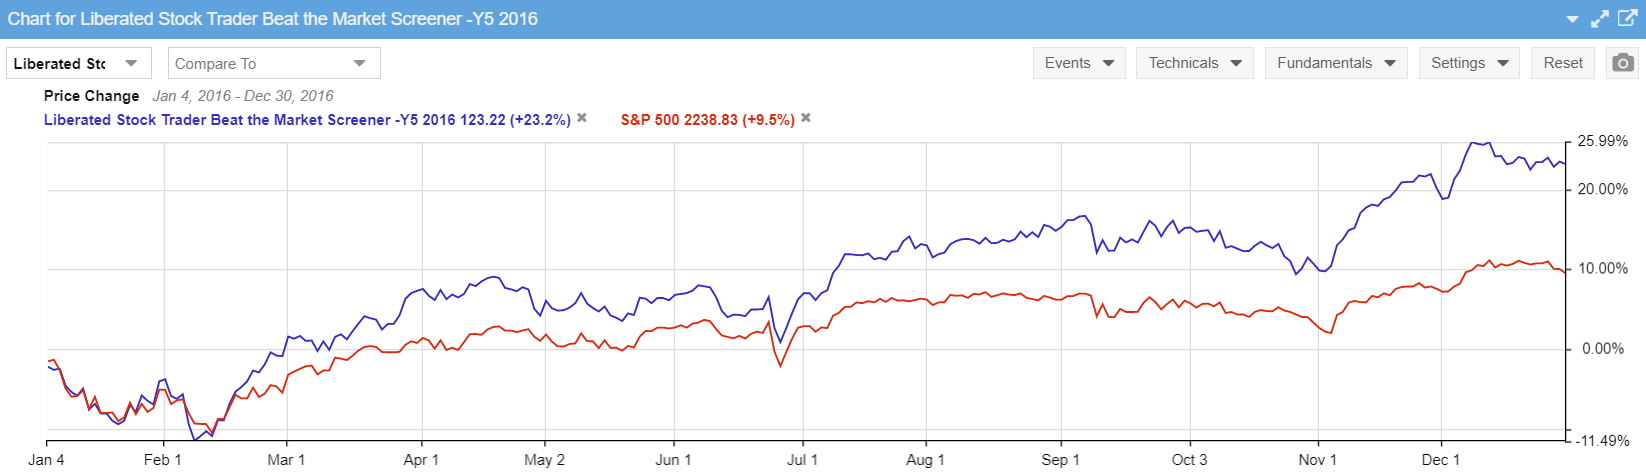
| 2016 | 1.10 | $147,250.56 | 1.23 | $220,761.42 |
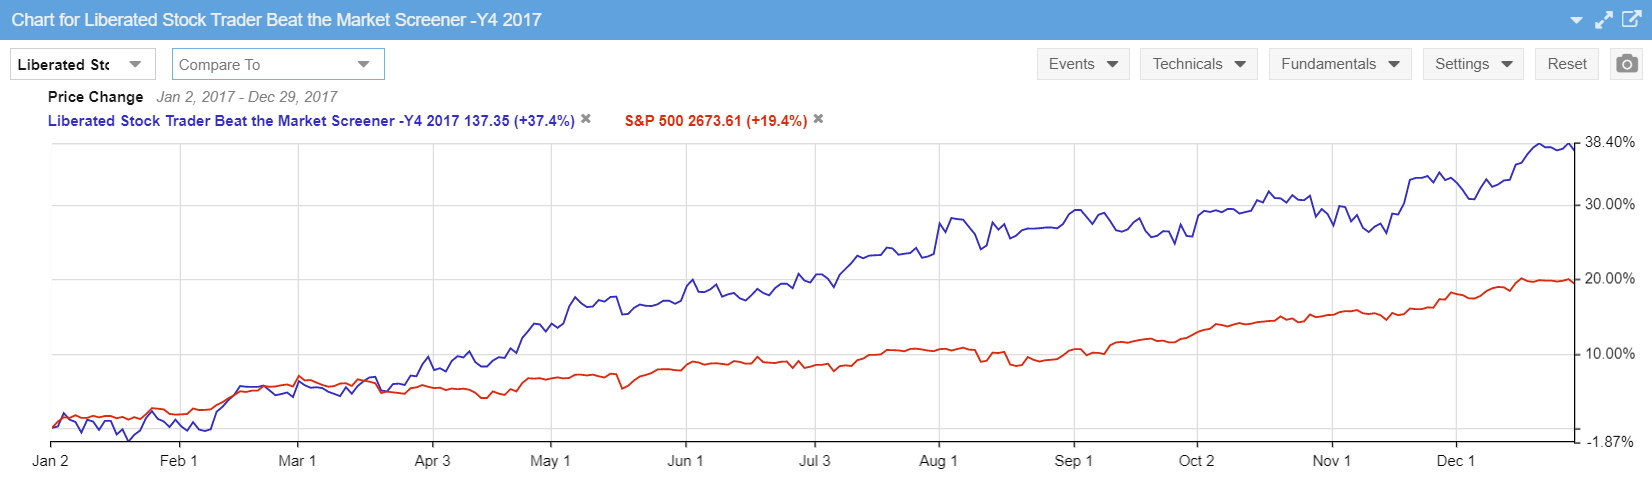
| 2017 | 1.19 | $175,817.17 | 1.37 | $303,326.19 |
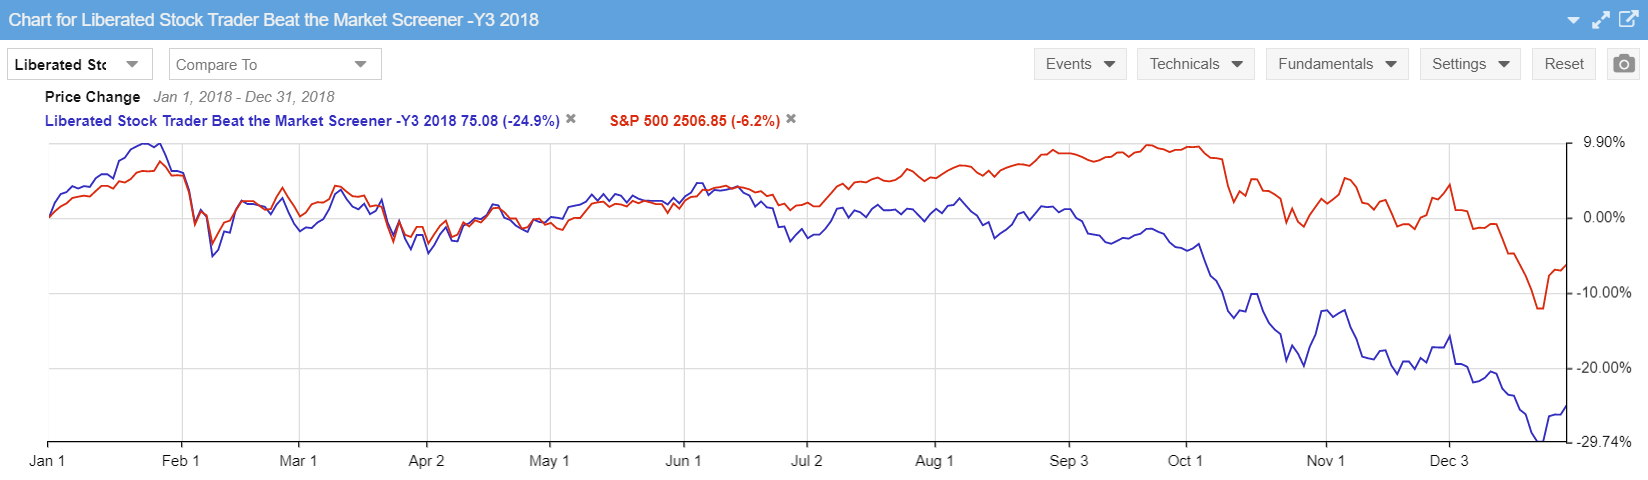
| 2018 | 0.94 | $164,916.50 | 0.75 | $227,797.97 |
| 2019 | 1.29 | $212,577.37 | 1.47 | $334,407.42 |
| Beat the market | 57% | |||
Criteria Present
Criteria Backtested
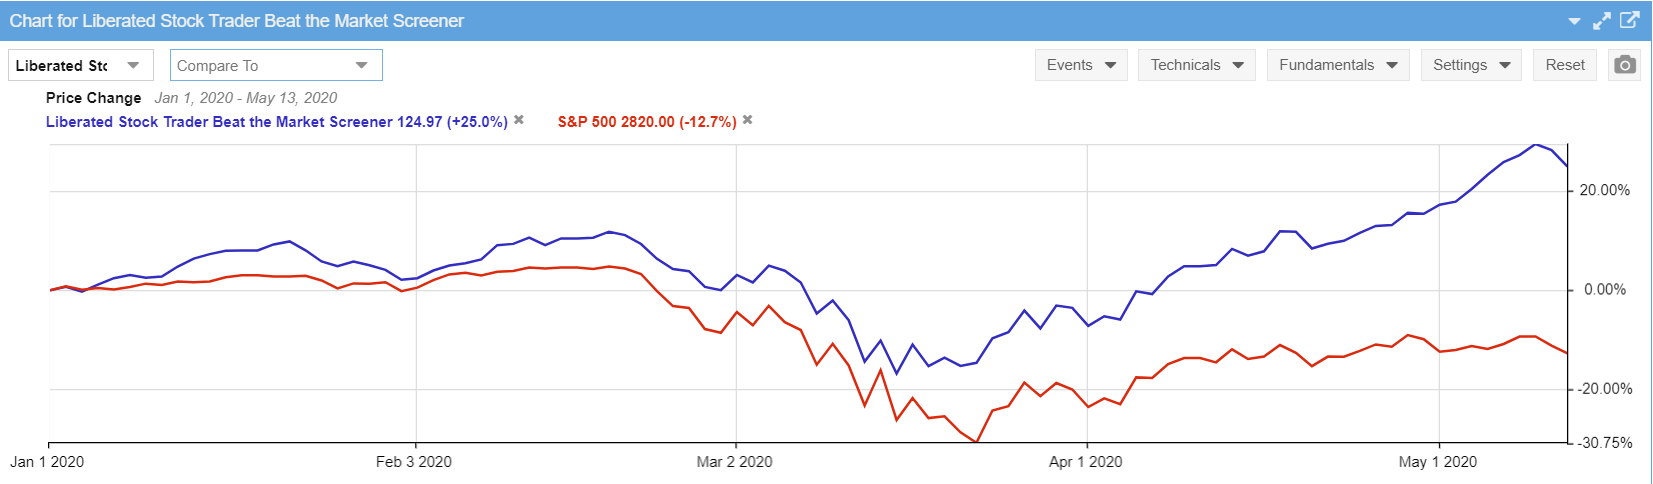
Liberated Stock Trader Beat the Market Screener 2020
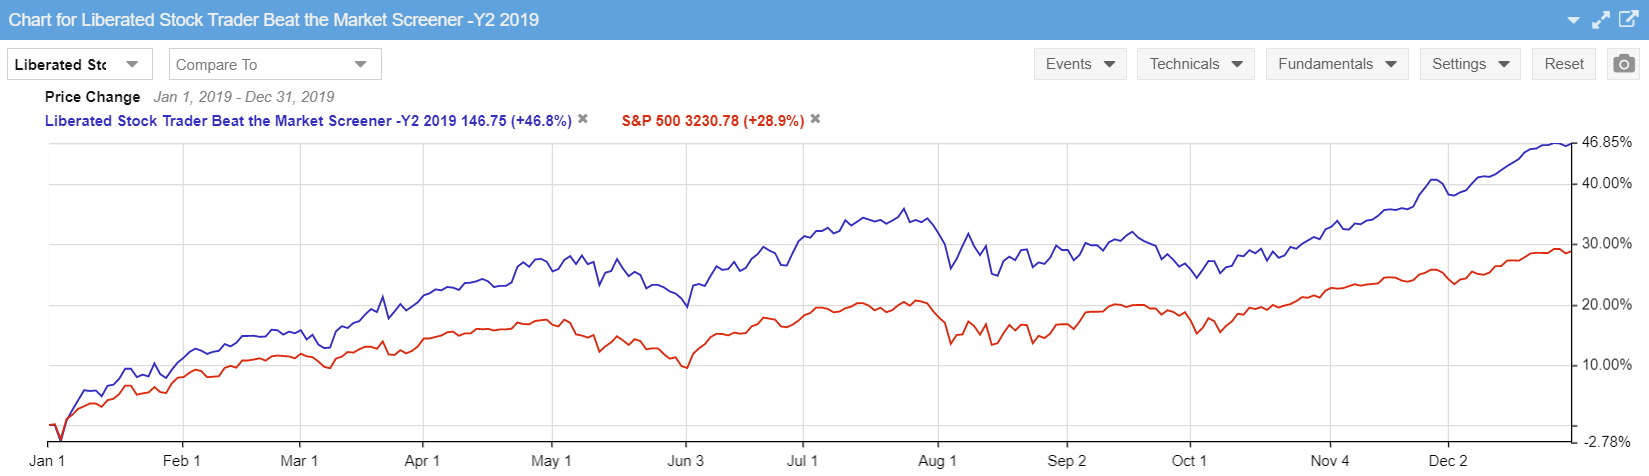
Liberated Stock Trader Beat the Market Screener 2019
Liberated Stock Trader Beat the Market Screener 2018
Liberated Stock Trader Beat the Market Screener 2017
Liberated Stock Trader Beat the Market Screener 2016
Liberated Stock Trader Beat the Market Screener 2015
Liberated Stock Trader Beat the Market Screener 2014
Liberated Stock Trader Beat the Market Screener 2013
Top