The Liberated Stock Trader Beat the Market Screener seeks to select stocks that have a significant chance of beating the S&P500 returns. The screener uses growth in free cash flow, and explosive EPS growth. Combining this with Joel Greenblatt’s ROC and Earnings Yield formulas “the Magic Formula” we have a selection of stock that beat the market 5 of the last 7 years.
The Screener is available for download in the Stock Rover’s Investor Library [1]. Further details on the backtesting at www.liberatedstocktrader.com/lst-beat-the-market-screener [2].
Contents
- Results [3]
- Criteria Present [4]
- Criteria Backtested [5]
- Liberated Stock Trader Beat the Market Screener 2020 [6]
- Liberated Stock Trader Beat the Market Screener 2019 [7]
- Liberated Stock Trader Beat the Market Screener 2018 [8]
- Liberated Stock Trader Beat the Market Screener 2017 [9]
- Liberated Stock Trader Beat the Market Screener 2016 [10]
- Liberated Stock Trader Beat the Market Screener 2015 [11]
- Liberated Stock Trader Beat the Market Screener 2014 [12]
- Liberated Stock Trader Beat the Market Screener 2013 [13]
Results
| S&P 500 | $100,000 | LST BTM | $100,000 | |
|---|---|---|---|---|
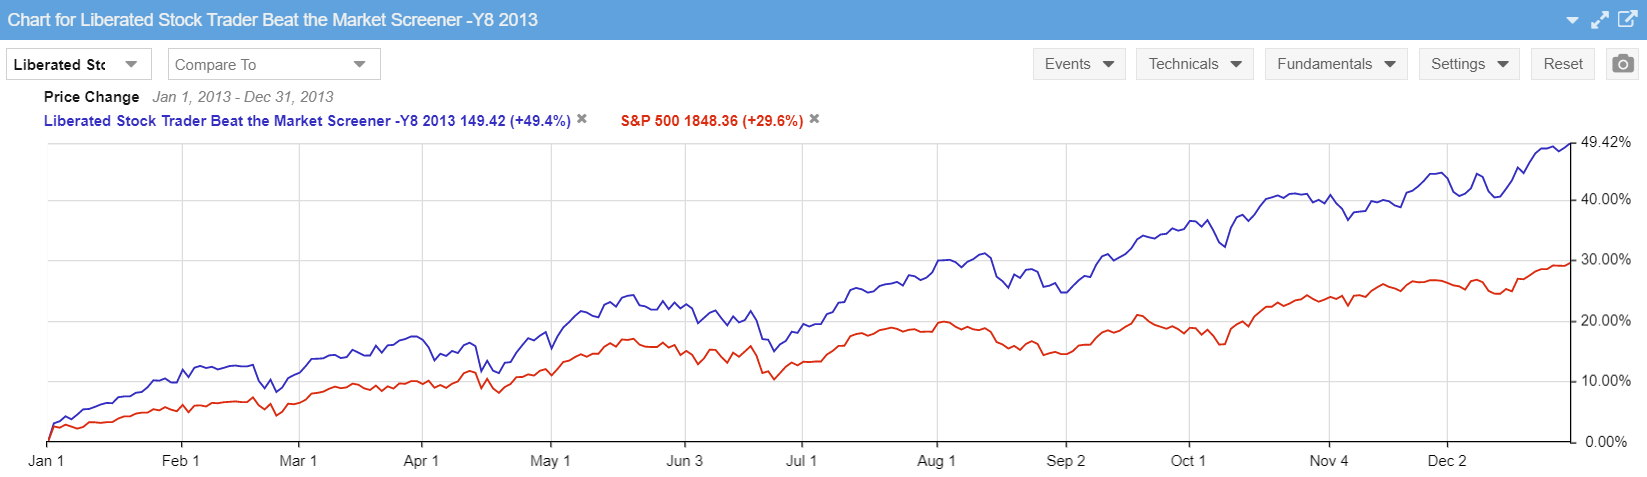
| 2013 | 1.30 | $129,800.00 | 1.49 | $149,400.00 |
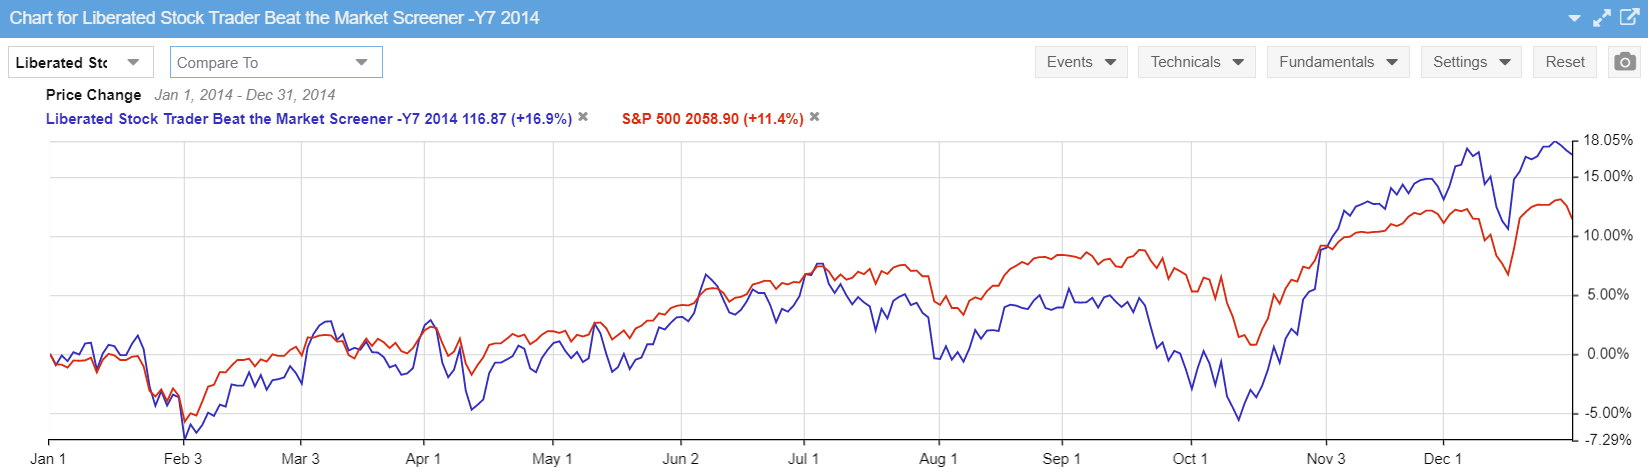
| 2014 | 1.11 | $144,597.20 | 1.17 | $174,648.60 |
| 2015 | 0.93 | $134,475.40 | 1.03 | $179,189.46 |
| 2016 | 1.10 | $147,250.56 | 1.23 | $220,761.42 |
| 2017 | 1.19 | $175,817.17 | 1.37 | $303,326.19 |
| 2018 | 0.94 | $164,916.50 | 0.75 | $227,797.97 |
| 2019 | 1.29 | $212,577.37 | 1.47 | $334,407.42 |
| Beat the market | 57% | |||
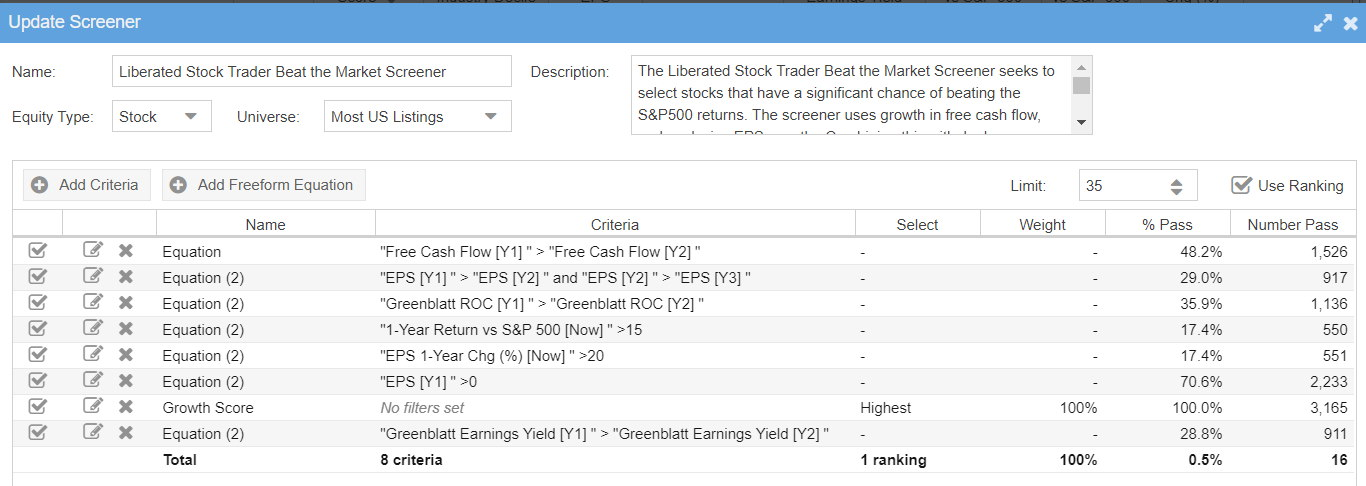
Criteria Present
 [14]
[14]
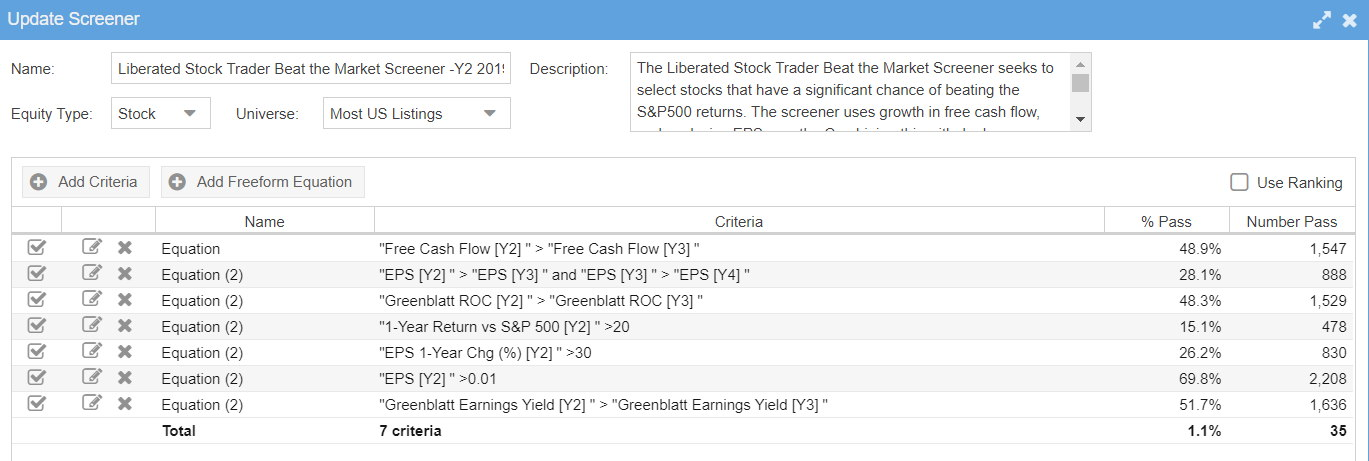
Criteria Backtested
 [15]
[15]
Liberated Stock Trader Beat the Market Screener 2020
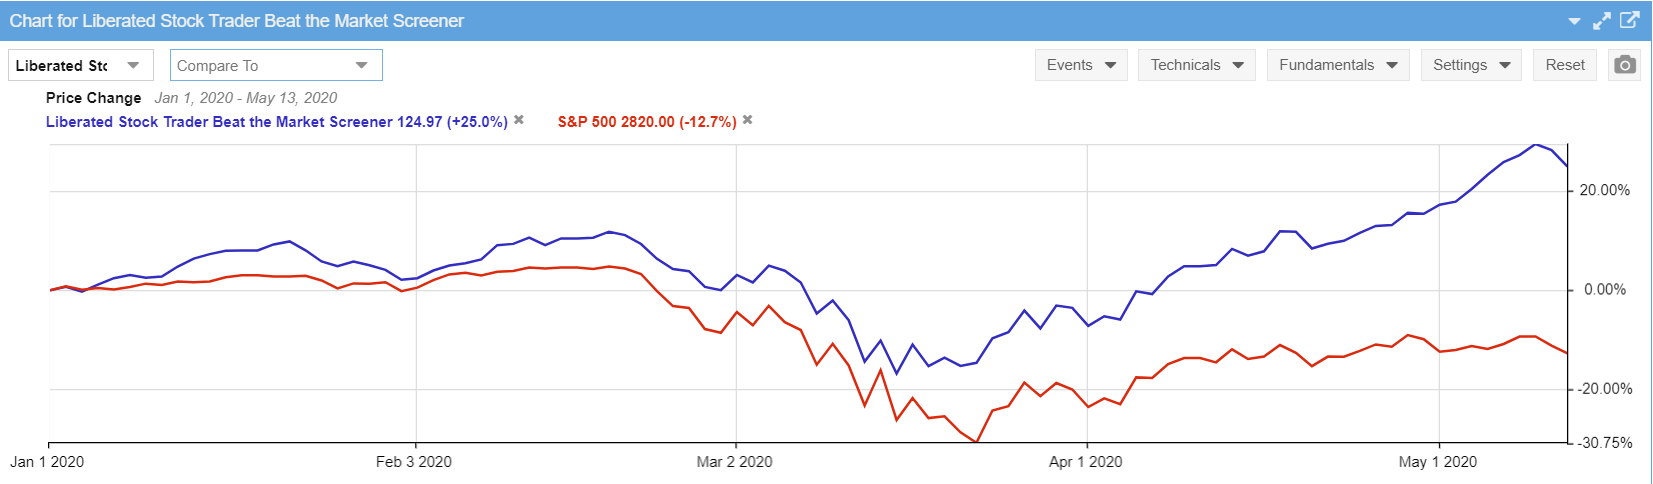 [16]
[16]
Liberated Stock Trader Beat the Market Screener 2019
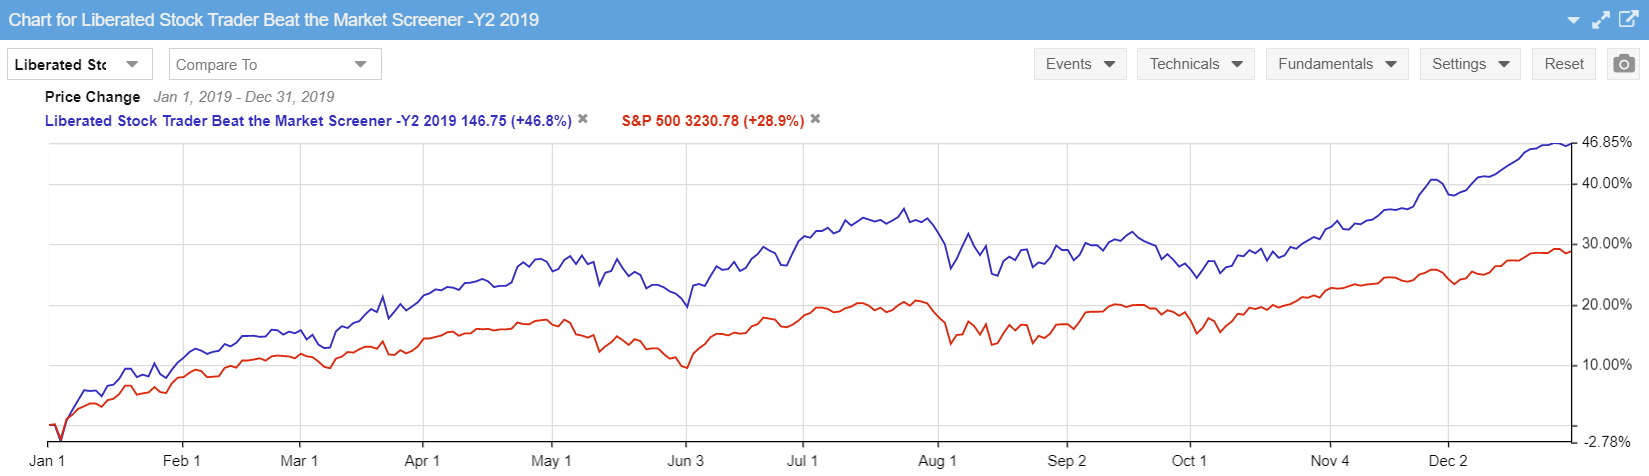 [17]
[17]
Liberated Stock Trader Beat the Market Screener 2018
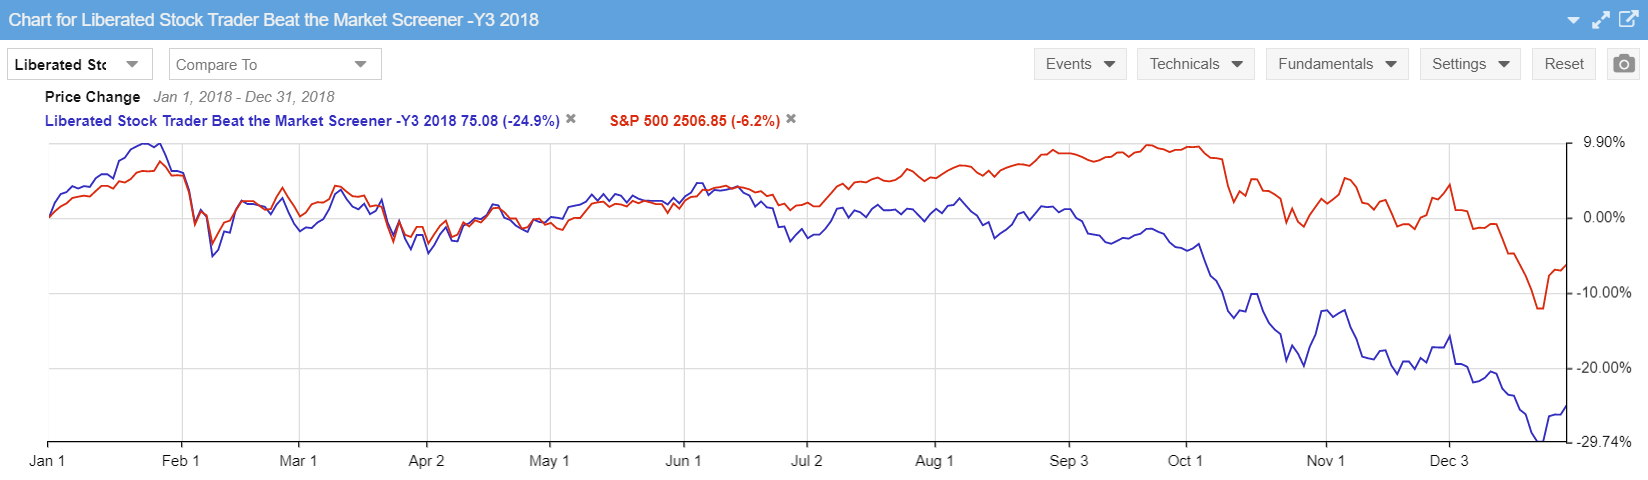 [18]
[18]
Liberated Stock Trader Beat the Market Screener 2017
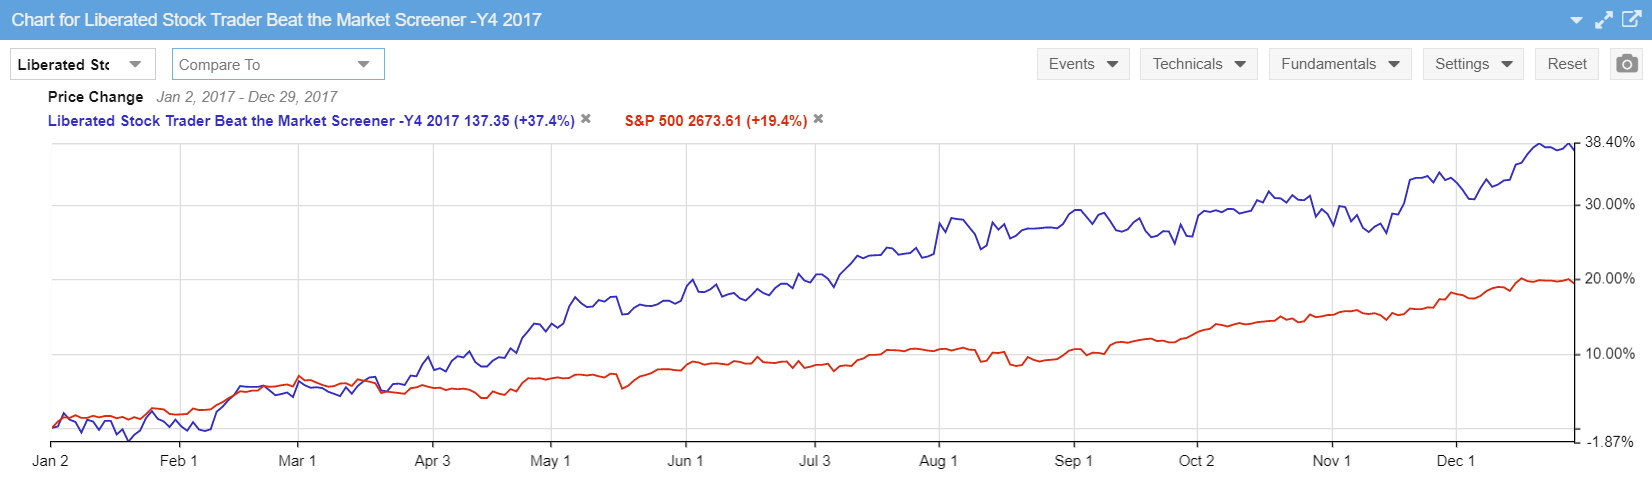 [19]
[19]
Liberated Stock Trader Beat the Market Screener 2016
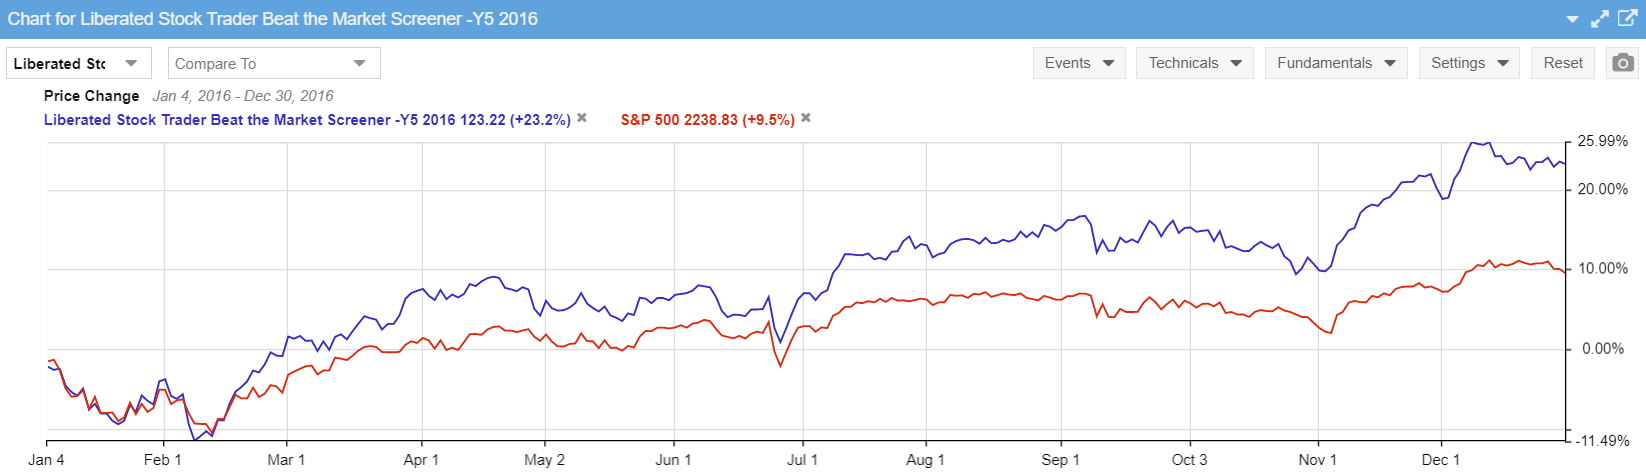 [20]
[20]
Liberated Stock Trader Beat the Market Screener 2015
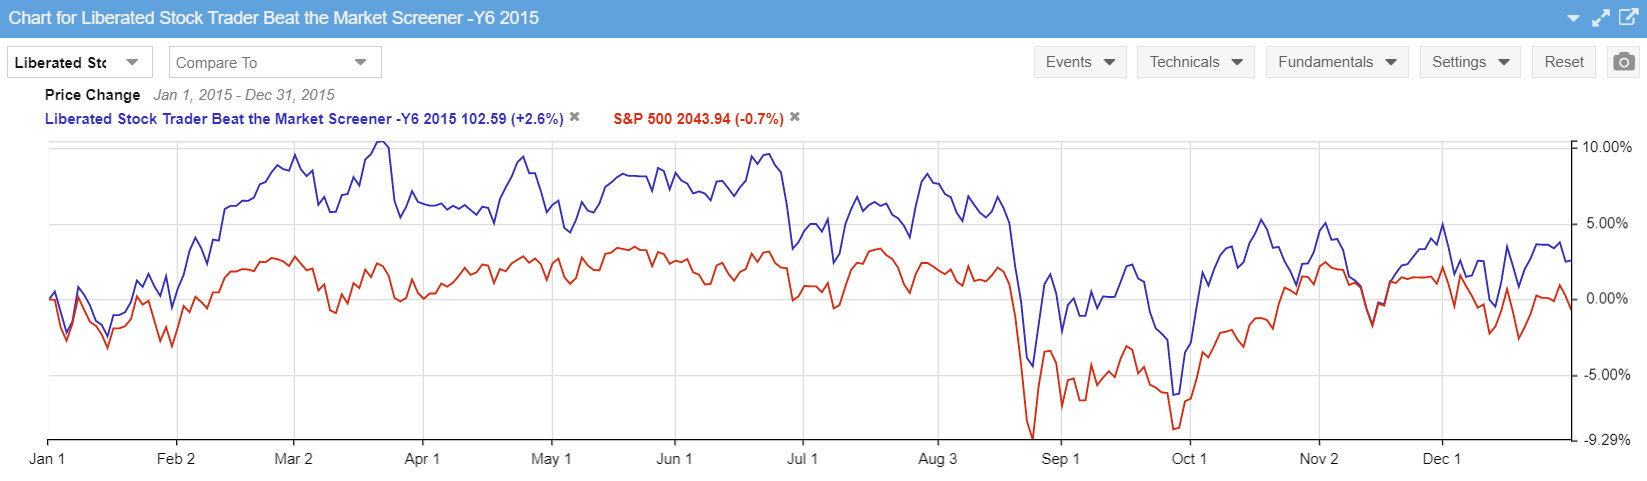 [21]
[21]
Liberated Stock Trader Beat the Market Screener 2014
 [22]
[22]
Liberated Stock Trader Beat the Market Screener 2013
 [23]
[23]