Introducing Stock Rover 7 in Beta
 Printer Friendly
Today we are very excited to share with you a beta release of Stock Rover 7, which marks a major evolution in the design and capabilities of our signature stock research platform. You can access the beta via your account dropdown menu when logged into Stock Rover.
In SR7, Stock Rover Markets has been integrated into the Stock Rover research web app. These two heavy-hitting resources—financial news and quotes on one, and deep dive stock screening and research on the other—are now available in one streamlined platform.
We’ve also completely updated the look of Stock Rover so that it is more modern and, well, easier on the eyes. These changes are not merely aesthetic. With the new design, you’ll find that financial data and program functions are more accessible and often easier to use.
In addition to the design overhaul, SR7 adds brand-new functionality, such as the ability to create custom metrics or screen on ETFs. Let’s take a look at these and a few other highlights of the new release.
Markets, News, and Research
At the top of SR7, you’ll this menu for Markets, News, and Research:

Use this to switch between market summaries, a news aggregator, and our multi-functional research app. When you login, you will land in the Research section by default. This section is what the rest of this blog post will focus on, but we encourage you to explore the Markets and News sections on your own. They are easy to use and full of useful information for investors.
Dashboard
The first thing you’ll encounter in SR7 Research is the brand new dashboard, which shows what the market, your portfolios, and your holdings are doing on a single screen. The dashboard gives a snapshot of your investments upon login, just as you might see when you login to your brokerage’s website. It also includes market updates and news, so you see current market context right away.
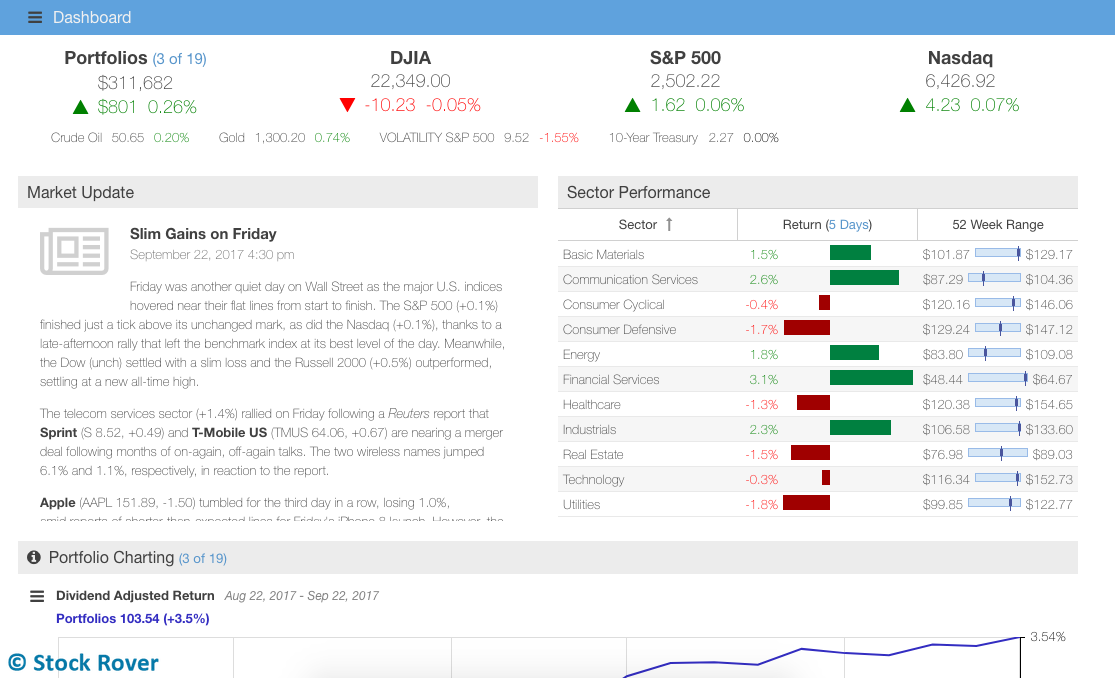
The dashboard, with portfolio charting and holdings detail just below the fold.
You can configure your dash by selecting which portfolios are included in the summary and benchmarks are charted via the menu buttons.
Navigation in SR7 is quite different than before. On the left side of the screen you’ll see the new charcoal-colored navigation bar:
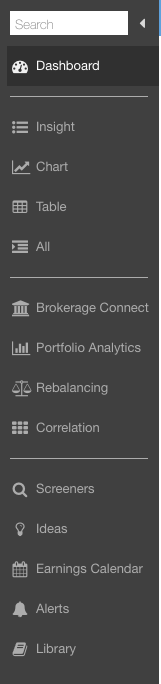
The navigation menu; it can be collapsed to allow more room for your research.
Where previously program functions shared screen space via resizable panels and window overlays, now everything is available as a full-size “snap-in.” Selecting anything from the nav bar will open in it in the main section of the page.
To see what we mean, explore the new Table, Chart, and Insight panels. SR7 makes it possible to focus on these functions individually, and quickly switch between them, rather than having them share screen space, which necessitated frequent resizing and minimizing or expanding. The new full-size snap-ins are a boon for anyone working on a laptop or small screen.
Of course, sometimes you may want to see everything side by side, like in the original configuration of Stock Rover. To see the Table, Chart, and Insight panels all in view at once, just select ‘All’ in the navigation menu.
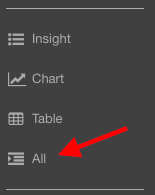
Key program elements are now broken out into full-screen pages. Choose ‘All’ to see them combined in a single screen, like in the original Stock Rover.
Other functions, such as the screener editor or portfolio analysis window, are now as handy as ever. Take a moment to run through the new menu—you’ll find that features that were previously two or three clicks away are now available with a single click.
The search field at the top of the navigation bar searches tickers as well as actions and capabilities. You can use this to add a quote to your quotes list, jump to a portfolio or watchlist, or start a task (“Add Column” for example). When in doubt, try a search.
Now for another important navigational tool. When you’re in Insight or Chart, you’ll see a list of tickers load on the left side of the screen, as boxed in the following image:
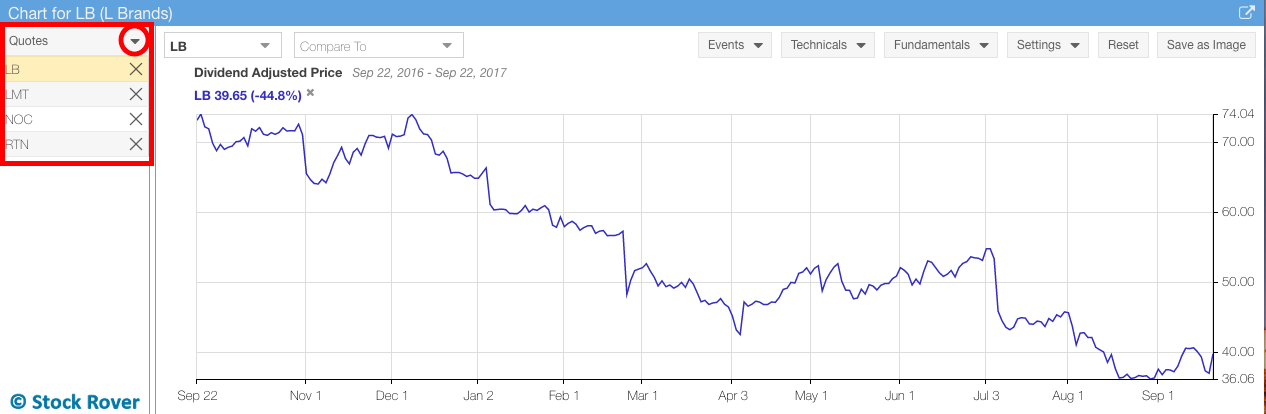
The ticker selector, boxed. This menu is populated via the dropdown navigation tree, circled.
The ticker selector list is populated via the dropdown navigation tree (circled in the above screenshot)—it could be portfolio holdings, screener results, or recent quotes, as well as whole portfolios or watchlists. The list will also open in the Table.
Try loading a population from the dropdown navigation tree, and then page through the Table, Chart, and Insight panels to see how it works. You can add a quote from the ‘Enter Ticker’ searchbox at the top of the page to see how that works too.
Just like in the original Stock Rover, you can also right-click a ticker for a menu of options pertaining to it:
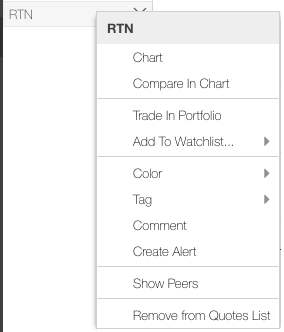
The menu of options when you right-click a ticker.
As before, this menu gives you the option to chart the ticker, add it as a secondary item in the chart (‘Compare in Chart’), add it to a portfolio or watchlist, set an alert, or give it a color, tag, or comment. Note that selecting ‘Show Peers’ will load that ticker’s industry peers in the selector list. It’s a shortcut alternative to using the dropdown navigation tree for loading an industry.
Custom Metrics (Premium)
The ability to create custom metrics from our existing metrics database has been a popular user wishlist item—now it’s here!
With the custom metrics feature, Premium users can create personalized columns for the Stock Rover Table. We’ll be going over this feature in more depth in a future blog post, but for now, here are the basics.
To create a custom metric, go to the Table > Views > View Options > Create Custom Metric, like here:
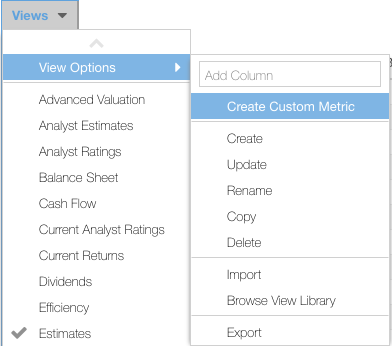
How to get to the custom metric editor. You can also find this option through the dropdown menu of any Table view tab.
This will open the custom metric editor, shown below, where you can create a formula comprising any of our existing metrics.
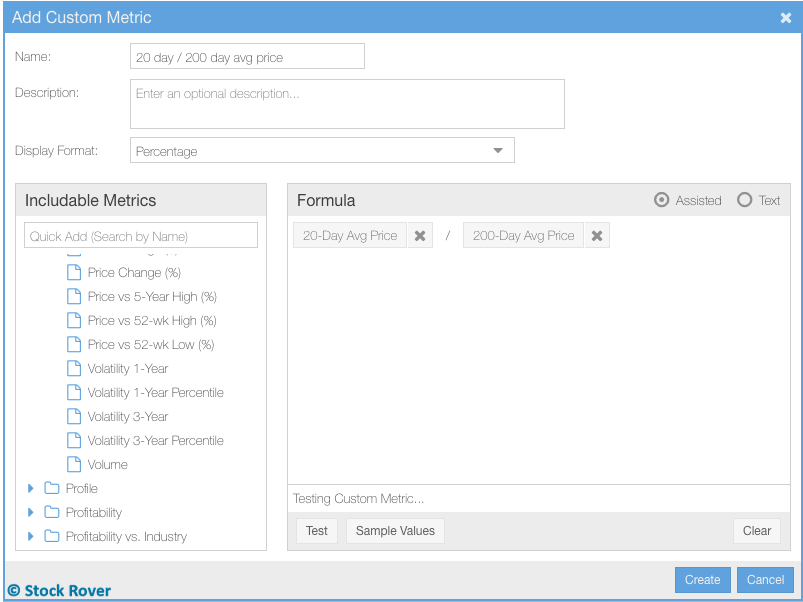
The custom metric editor. Select metrics from the left to include them in a mathematical formula that you create in the box on the right. You can test that the formula works before you save it.
For those of you familiar with our equations screening, you’ll find this to be very similar. Once you have created a metric, it will be available in your Table and will function just like any other column.
ETF Screening
ETFs are a popular investment instrument that offers diversification benefits similar to that of a mutual fund, but with lower management costs (expense ratios). As with other types of funds, it’s a big world with lots of ETFs to choose from. SR7 now makes it possible to screen for great ETFs based on expense ratio, performance, dividends, market cap, and other criteria.
To create an ETF screener, go to Screeners > Create Screener, as shown below.
How to create a new screener.
From the screener editor that opens, simply select ‘ETF’ from the Equity Type menu, shown in the following image.
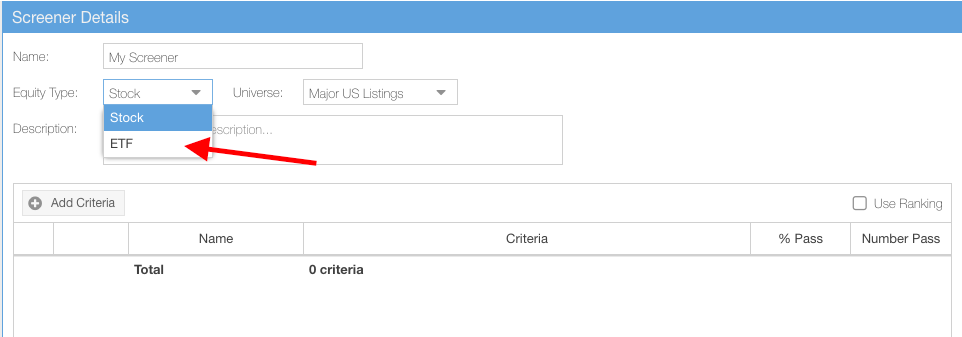
For ETF screening, select ‘ETF’ from the Equity Type dropdown.
You can then proceed to create your screener like you would for any stock screener. The list of available screening criteria will be modified so that it is only relevant to ETFs.
Folders for Screeners and Watchlists (Premium)
It is now possible for Premium users to organize watchlists and screeners into folders. While this was already possible with portfolios, this is the first time it’s possible to organize your other saved items.
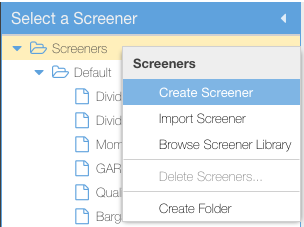
To create a folder, right-click the top line in the navigation tree when you are either on the Watchlists or Screeners page. You’ll find ‘Create Folder’ as an option, as below.
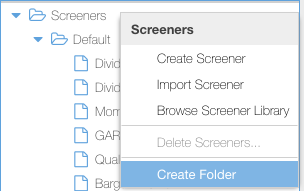
Create folders to organize your screeners watchlist or portfolios.
Once your newly created folder appears in the navigation tree, simply drag and drop items into it.
Expanded Insight Summary
Navigate to the Insight panel to see two additions to the Summary tab. One is the Ratings section, showing a snapshot of analyst ratings and target pricing for the selected stock. This information was previously found in its own tab in Insight, but now it’s right there alongside other key company info.
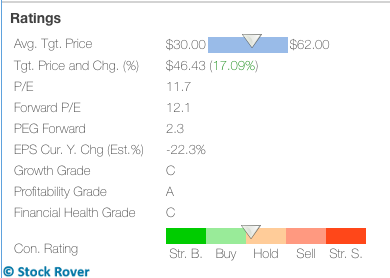
The Ratings section of the Insight Summary tab.
Scroll down on the same page to see the Competitors section. This gives you a shortlist of the competitors from the same industry, based on industry, exchange, and revenue targets. Here’s an example:
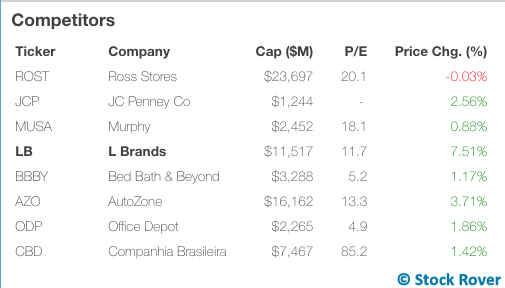
The Competitors section of the Insight Summary tab is a great, quick way to find relevant companies for comparison.
Try It Out!
Now that you know about the major changes to Stock Rover with V7, why not take it for a spin? Just login and find ‘Try V7 Beta’ in your account dropdown menu (you can always go back to the standard version of Stock Rover through this menu). Rest assured that any changes you make in V7 will propagate to V6 and vice versa, so you can move freely between the two versions without losing work.
We hope you’ll find SR7 to be intuitive to navigate, fun to use, and even more powerful than the original Stock Rover. Keep in mind that this version is still in beta. If you encounter problems or bugs, or wish to send any other feedback, please get in touch with our team. The best way to do this is to use ‘Contact Us’ from the account dropdown menu. We look forward to hearing your thoughts.
Comments
Comments are closed.
Top
I’m really excited to try this out. I am still learning Stock Rover, but so far, it’s a fantastic tool (e.g., it’s fast and flexible). Really glad to see you folks are pushing the development
I like the beta, nice improvements, though as an income investor I was hoping to find a column that would state the % of the portfolio income an individual stock represents. Also, similar to the Portfolio Allocation pie charts having one for income by holding would be great.
Thank you for your suggestions. These are good ideas and we will add them to our development roadmap.
Thanks in advance for this update. I have two comments/questions.
1) I have trouble getting V-7 to launch in Chrome – it just shows the “waiting” clock. SR V-7 works in Edge but I’ve had much better results using Chrome for everything else I do.
2) I would still love to see the ability to:
Chart P/E’s on estimates (yr-1, yr-2, and NTM)
Chart and/or download relative P/E (also P/B, EV/EBITDA) between a single stock and another stock, index, or sector. I realize I can do this at a rudimentary level in the Table, but it is painful and not very comprehensive given it’s limited to quarter or year-end figures.
Thanks!
For the problem you’re having with Chrome – please try clearing the browser cache – that should fix the problem.
And, thank you for your suggestions – they have been forwarded development, and will be considered for a future release.
Hello, sure would be nice if remote use [iPad] would allow access to features and services available when in front of desktop.
We agree and we are working on it.