

Introducing Enhanced Ticker Tooltips
 Printer Friendly
Introduction
When analyzing investment opportunities in the Stock Rover Table, quick access to contextual data is critical to maintaining a fast, efficient workflow. For years, hovering over a ticker symbol brought up our trusty Classic tooltip, providing a reliable snapshot of basic profile information and valuation metrics.
Stock Rover Table Views have always given you the flexibility to display strategy-specific data. Whether you choose an out-of-the-box View or build one from scratch, you can load a Dividend view for income research, a Value view for fundamental analysis, or a Momentum view for tracking trends. However, no matter which Table View you currently have open, you often need immediate insight into a different dimension of a stock without switching your entire table layout. A dividend investor checking a value table still wants quick visibility into payout safety, while a growth investor evaluating a momentum table might want an immediate look at fundamental quality scores.
Today, we are excited to introduce fully customizable, strategy-specific Ticker Tooltips. This new feature delivers a powerful extra layer of flexibility, allowing you to instantly examine any ticker through your preferred analytical lens regardless of your active Table View.
Configuring Your Ticker Tooltips
Setting up your new ticker tooltip display is simple and handled entirely within your account preferences.
To begin customizing your view, click on your account username in the top right corner of Stock Rover, select Preferences, and scroll down to the Ticker Tooltip panel in the lower right corner.
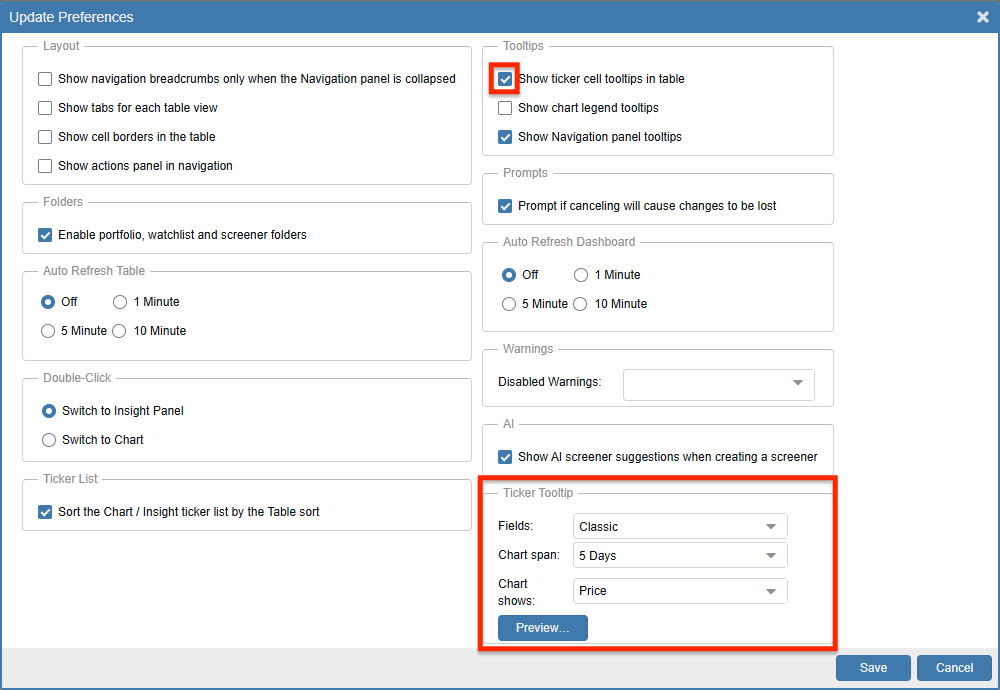
Configure your tooltip fields, chart span, and display units in Preferences.
From the Ticker Tooltip configuration panel, you have three powerful customization options:
- Fields: Choose the specific category-focused data layout displayed when hovering over a ticker symbol. You can select from seven distinct options: Classic, Value, Growth, Quality, Dividend, Trader, or Dense.
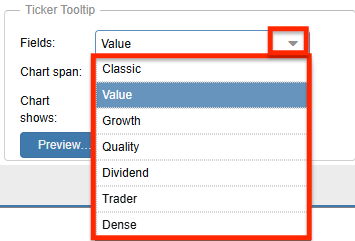
Choose from seven specialized field presets matching your investment philosophy.
- Chart Span: Adjust the historical timeframe plotted on the integrated mini-chart inside the tooltip, ranging from 1 Day up to 5 Years.
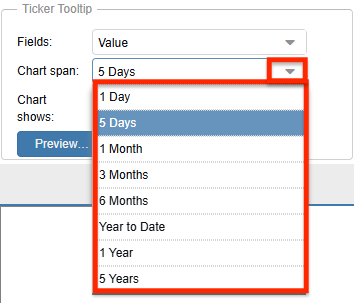
Set your preferred default historical window for the tooltip mini-chart.
- Chart Shows: Toggle the vertical axis and trendline between absolute dollar Price values and percentage performance Change (%).
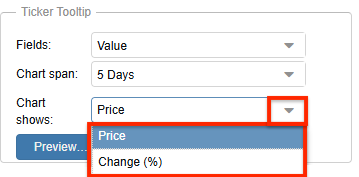
Display the chart trendline in raw dollars or relative percentage growth.
Exploring the Ticker Tooltip Layouts
Each tooltip layout is tailored to bring forward the exact metrics most relevant to specific investment styles. Here is a breakdown of the seven available options:
Classic
The Classic view retains the familiar layout existing users know well. It pairs baseline company profile information (Sector, Industry, Market Cap, Beta) with fundamental valuation metrics and forward projections, such as P/E, EPS, Analyst Price Targets, and Forward Dividend Yield.
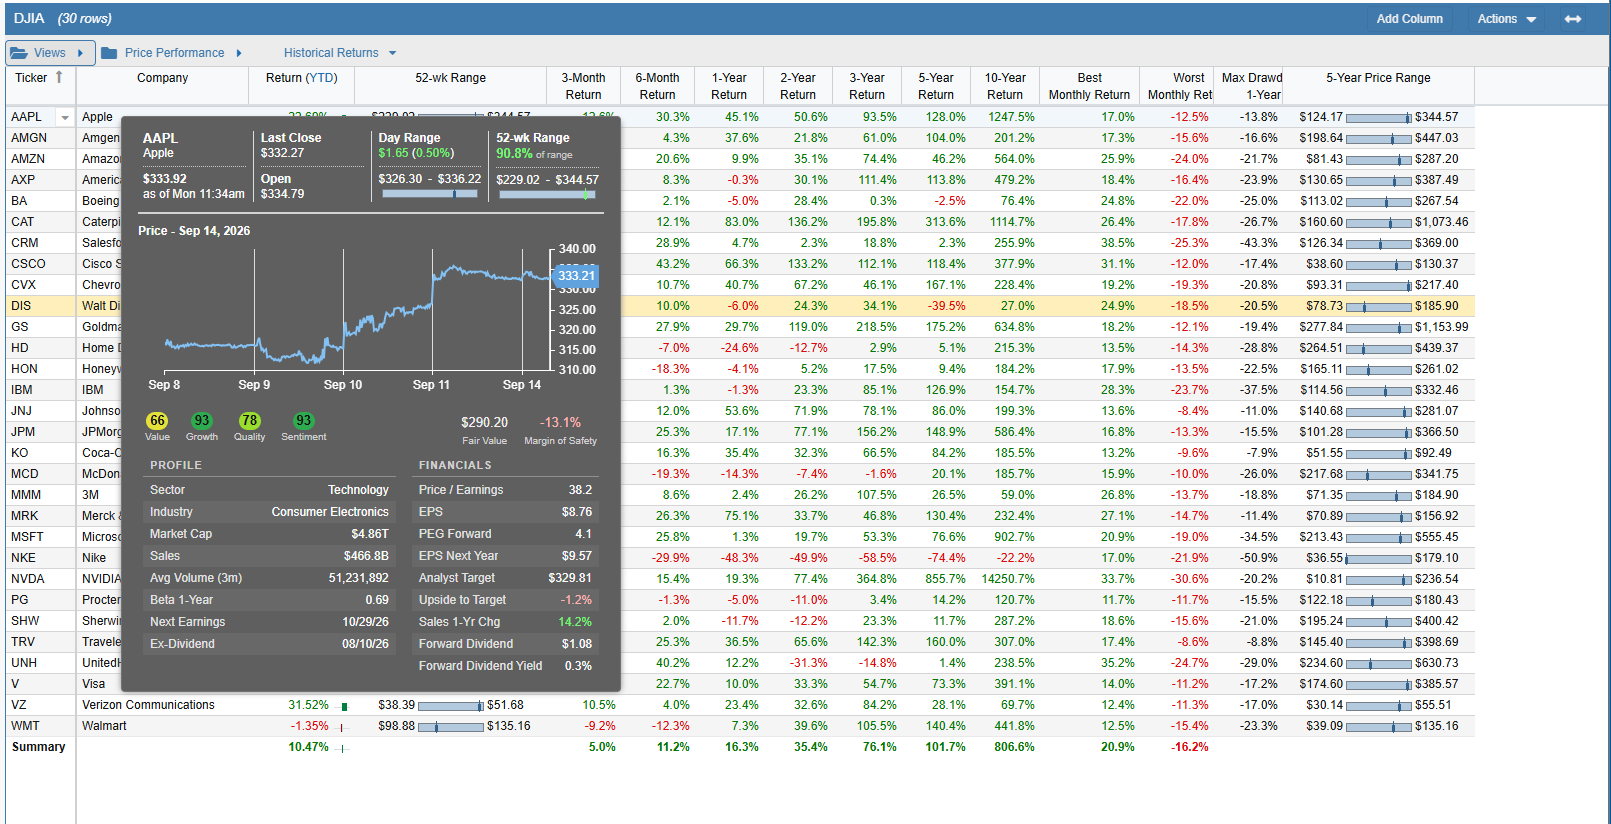
The Classic view provides a broad, general-purpose overview of ticker fundamentals.
Value
The Value tooltip is engineered for bargain hunters and margin-of-safety investors. It focuses on valuation multiples alongside key industry decile rankings for Price/Earnings, Price/Book, and Price/Cash Flow. It also shows deep forensic accounting metrics including the Piotroski F-Score, Altman Z-Score, and Beneish M-Score.
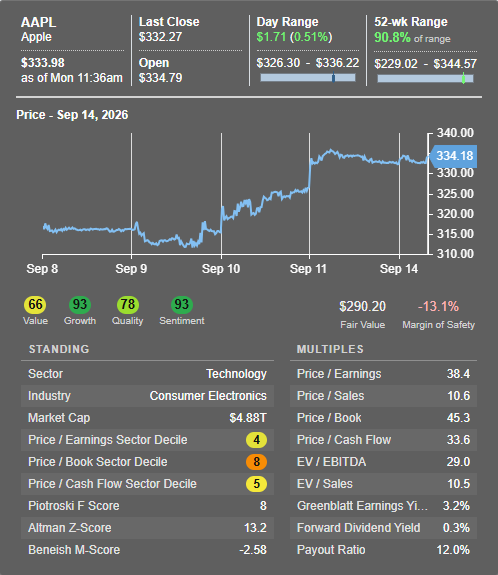
The Value layout highlights valuation multiples, sector deciles, and balance sheet safety scores.
Growth
For expansion-minded investors, the Growth tooltip highlights top-line and bottom-line momentum. The left column shows historical 1-Year, 3-Year, and 5-Year compound growth rates for Sales and EPS, while the right column focuses on forward estimates, EBITDA growth projections, PEG ratio, and recent EPS surprise percentages.
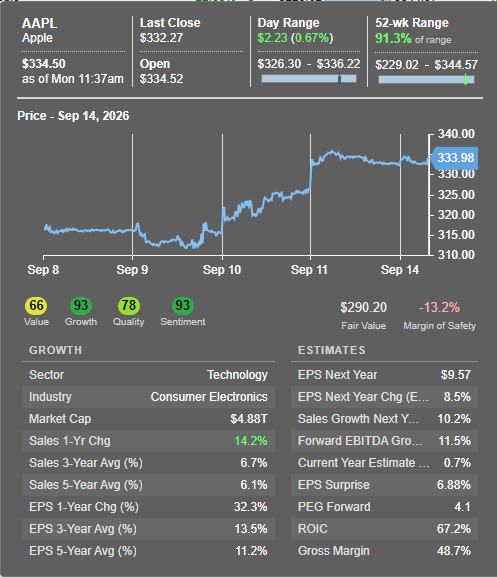
The Growth layout focuses on historical growth trajectories alongside forward-looking estimates.
Quality
The Quality layout prioritizes business moat indicators, capital efficiency, and profitability. Key data points include Return on Invested Capital (ROIC), Return on Equity (ROE), Return on Assets (ROA), Gross/Operating/Net Margins, and solvency metrics like Debt to Equity and Interest Coverage.
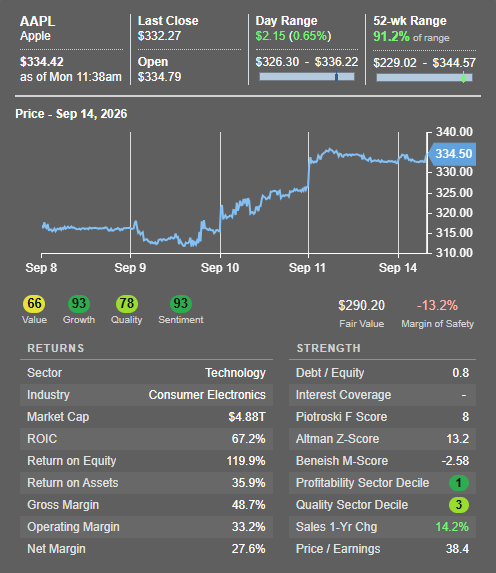
The Quality layout spotlights operational efficiency, profitability margins, and financial strength.
Dividend
Tailored specifically for cash flow and dividend growth investors, the Dividend tooltip shows everything you need to assess income sustainability. It details Forward Dividend Yield, Ex-Dividend dates, consecutive payout growth years, payout ratios, 1/3/5-year dividend growth averages, and Stock Rover’s proprietary Dividend Safety Score.
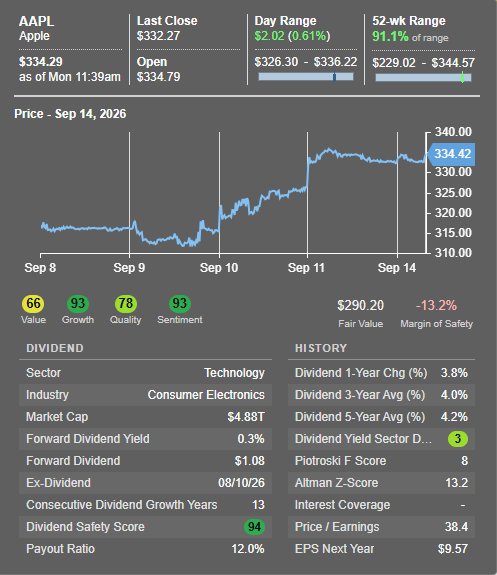
The Dividend view highlights cash flow metrics, payout histories, and safety scores for income investors.
Trader
Built for tactical traders and technical analysts, the Trader layout puts technical indicators and volume dynamics front and center. It displays 10-day vs. 3-month average volume, short interest % of float, Relative Strength Index (RSI), moving average comparisons (50-day and 200-day), and benchmark performance comparisons against the S&P 500 across multiple timeframes.
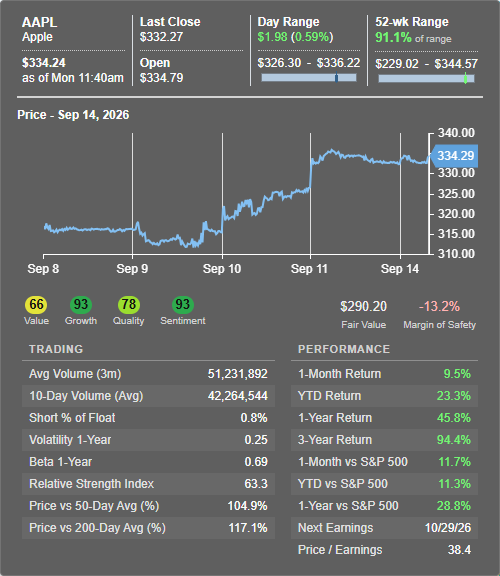
The Trader layout shows volume, technical indicators, moving averages, and relative S&P 500 performance.
Dense
If you prefer maximum data coverage without switching screens, the Dense layout is a power-user favorite. It combines the fundamental background of the Classic view with an expanded set of financial ratios, valuation multiples, capital efficiency scores, and forward projections into a compact, information-rich window.
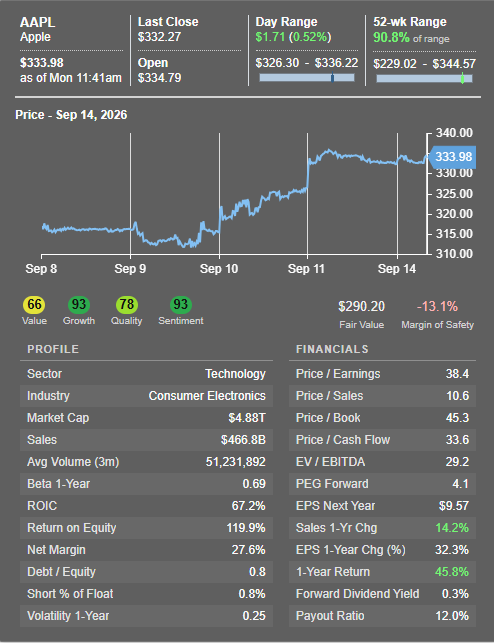
The Dense view provides a high-density combination of core profile, valuation, and quality metrics.
Frequently Asked Questions
Which plans include the customizable Ticker Tooltips?
The new customizable Ticker Tooltips feature is available exclusively to users subscribed to the Ultimate and Ultimate Pro plans.
Why aren’t my ticker tooltips appearing when I hover over symbols in the Table?
Ensure that the feature is turned on in your preferences. Open Preferences, look under the Tooltips block in the upper right corner, and confirm that “Show ticker cell tooltips in table” is checked.
How do I change my ticker tooltip settings?
Click on your account username in the top right, select Preferences, scroll down to the Ticker Tooltip section in the lower right, choose your preferred Fields, Chart Span, and Chart View settings, and click Save.
Can I test my layout before saving?
Yes! Simply click the Preview… button inside the Ticker Tooltip preferences box to launch an interactive preview of your chosen data layout and chart timeframe.
Can I still use the original Stock Rover tooltip format?
Yes, absolutely. To keep using the legacy layout, select Classic from the Fields dropdown menu in your Ticker Tooltip preferences.
Try It Today! Customized Ticker Tooltips are live right now in your Stock Rover account. Head over to your Preferences menu, select the layout that matches your investment style, and make your Table research faster and more tailored than ever. If you have any questions or feedback, reach out to our team at support@stockrover.com.
Top