Improvements in the Newest Release of Stock Rover
 Printer Friendly
The newest release of Stock Rover is out today and we want to give you a rundown of the changes you will see. There are added capabilities, performance improvements, and some minor aesthetic adjustments, all of which are aimed at providing a better financial research experience. So, without further ado the changes are…
Contents
- Expanded Task Wizard
- Screening Windows Updated
- Portfolio Windows Updated
- Filter the Table Window Added
- Page through more than 100 tickers
- Screener can now return up to 250 passing tickers
- Charts draw much more quickly on IE
- Multi-select in Table and Peers tab
- Exchange Metric added
- Return on Invested Capital Metric Added
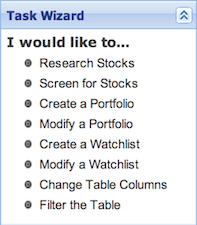
Expanded Task Wizard
More tasks have been added to the Task Wizard, so now you can modify a portfolio or a watchlist, and filter the Table just at the click of the mouse. In addition, some of the Task Wizard windows have been redesigned in order to be simpler and more consistent across the tool. Here they are with some screenshots so you can know what to expect.
Screening Windows Updated
The Screen for Stocks window gives you a summary of your screeners, lets you easily modify or run any of the screeners, and lets you create a new screener.
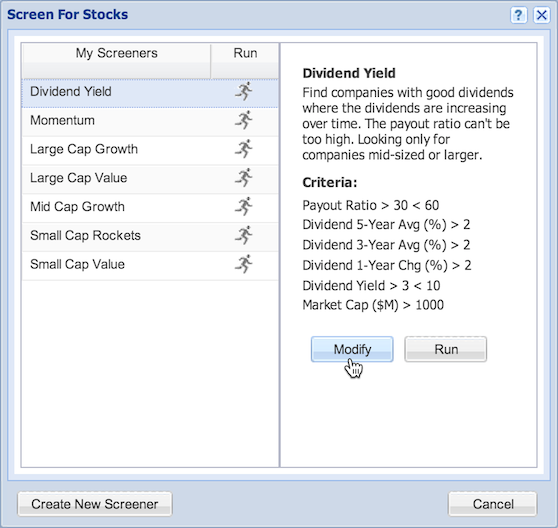
The screener manager window has also changed significantly. We’ve done away with the less-than-loved four-paneled manager from before, and instead have replaced it with a simpler four-step manager, which you can see pictured below.

Moving down the manager, you first name and add notes to the screener in Step 1, in Step 2 you select a column on the left, either through the folders or by using the Quick Select box, and add screening values on the right, and it is automatically entered into Step 3, where you can review your screener criteria, and then in Step 4 you simply update (or create) your new screener.
Portfolio Windows Updated
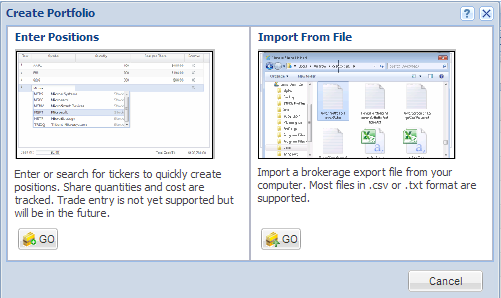
The Create a Portfolio task has been totally revamped; first, you’ll be asked if you want to enter positions or import a portfolio, shown below.
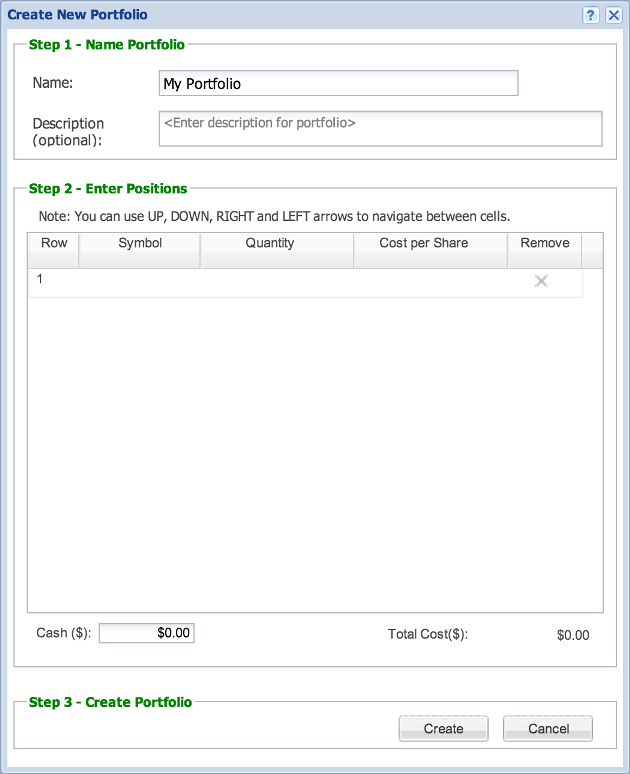
After choosing either of these, it will bring you to the new three-step manager window (shown below), where you can enter the name and description; add symbols, quantities, cost per share, and cash; and then create the portfolio.
Filter the Table Window Added
Finally, the Filter the Table task lets you easily filter by any of the columns that are currently in the Table. Just select one of the listed columns (or add a new one) in Step 1, add a filter value in Step 2, and apply the filters to the Table in Step 3. Shown below.
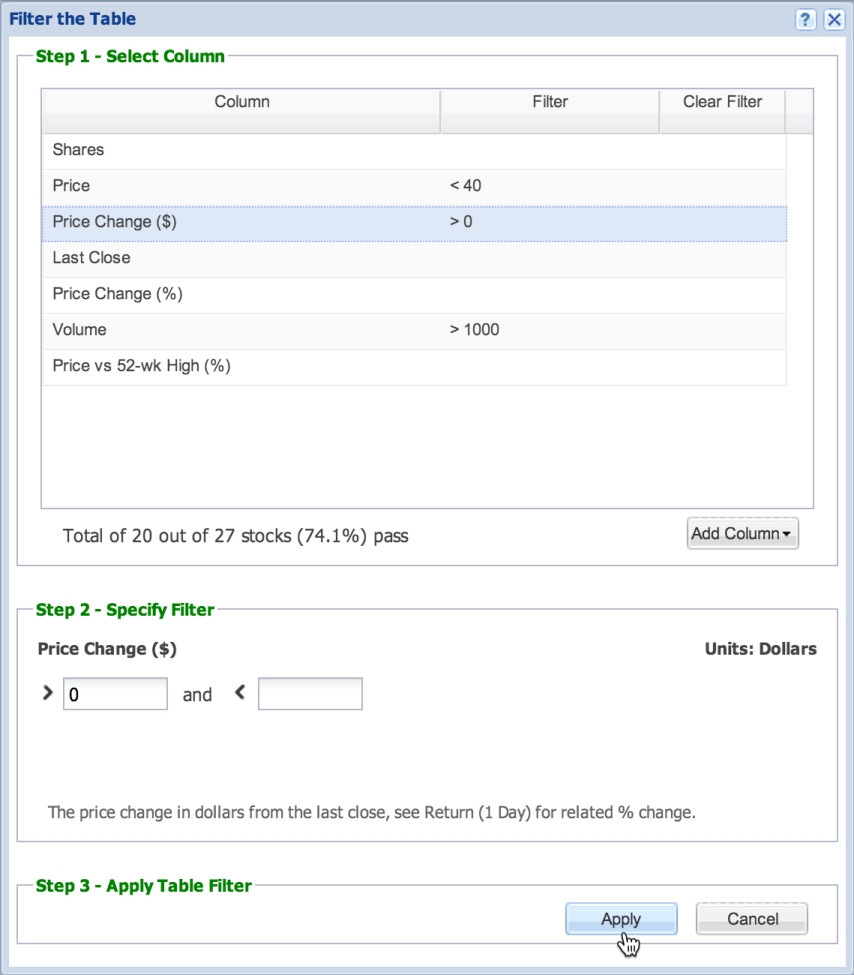
As always, clear the Table filters by clicking the ‘Filter’ button in the Table’s toolbar and selecting ‘Clear Filters.’
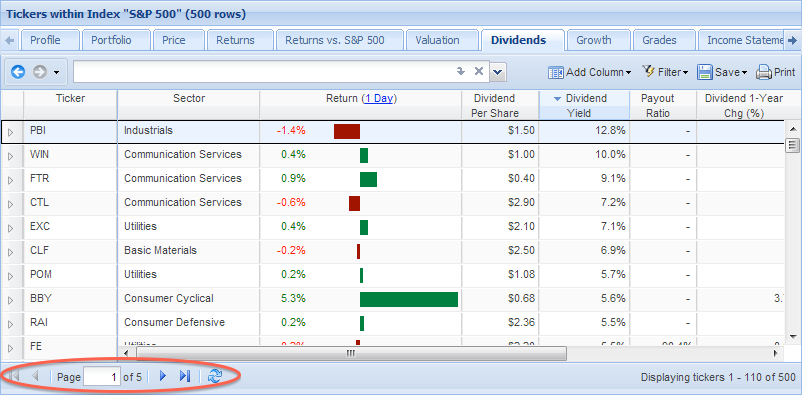
Page through more than 100 tickers
Many of our users will be excited to learn that the Table no longer has a 100 ticker limit. Previously, if you had selected to view a group of tickers that numbered more than 100 (such as the S&P 500), only 100 tickers were shown, and the ones that were displayed depended on the sorting and filtered enabled. Now you can page through all the tickers by clicking the arrows at the bottom of the Table.
Screener can now return up to 250 passing tickers
The screener will now display up to 250 tickers in the Table, whereas before it only allowed 100, and you can use the arrows to page through the results.
Charts draw much more quickly on IE
Previously, those using Internet Explorer were experiencing slowness with the chart, but with the new fixes we’ve made you should be able to chart much more quickly now.
Multi-select in Table and Peers tab
You can now select multiple tickers in both the Table and the Peers tab to perform the same action on several tickers at once. Just hold shift while clicking to select a contiguous group or tickers, or hold control while clicking to select a group of separate tickers (both of these are in line with current conventions).
All the same actions are available with multi-select, so for the Table this includes, charting, adding and removing from portfolios or watchlists, adding a research note, coloring, and hiding the rows. Access the drop-down menu for these tickers the same as before: by right-clicking any of the tickers, or by hovering over a ticker and clicking the down-arrow that appears.
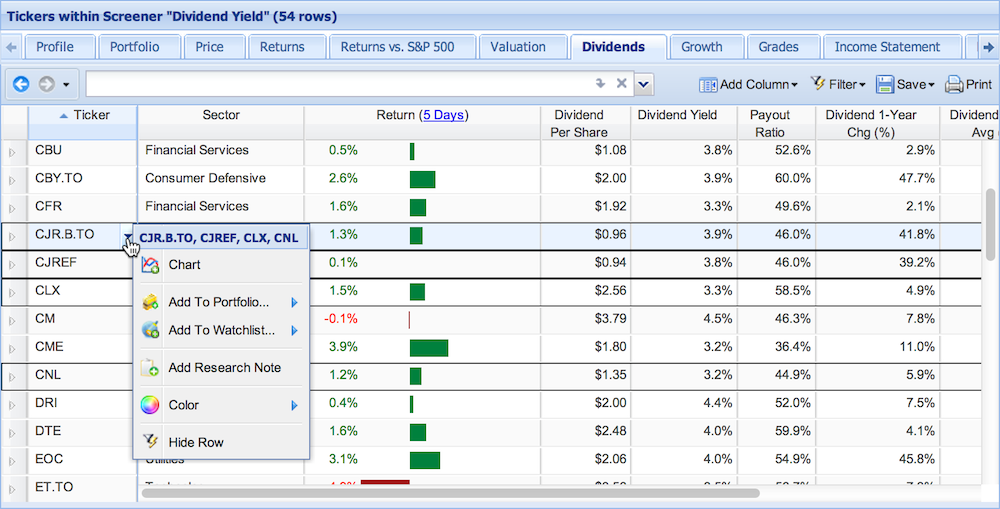
Additionally, if the chart is linked to the Table and you multi-select, all of the tickers will be added to the chart, along with any secondary tickers that were already in the chart.
For the Peers tab, multi-select means you can add several tickers to the Table as Research Tickers at once, and you do this by clicking the green plus icon of any of the selected tickers.
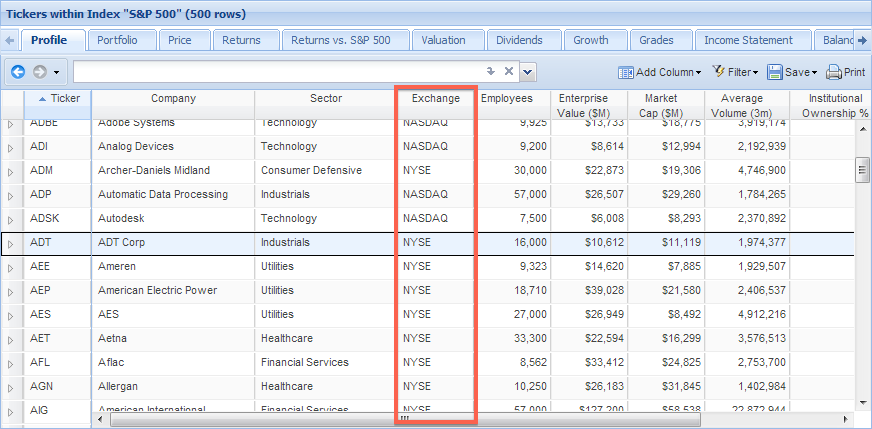
Exchange Metric added
You can now add the “Exchange” column to any of the views to see which exchange the ticker is traded on. The Exchange metric is filed categorized under the “Profile” group of metrics.
Return on Invested Capital Metric Added
We have another new metric, which is the Return on Invested Capital, or ROIC, and it is categorized as a Profitability metric.
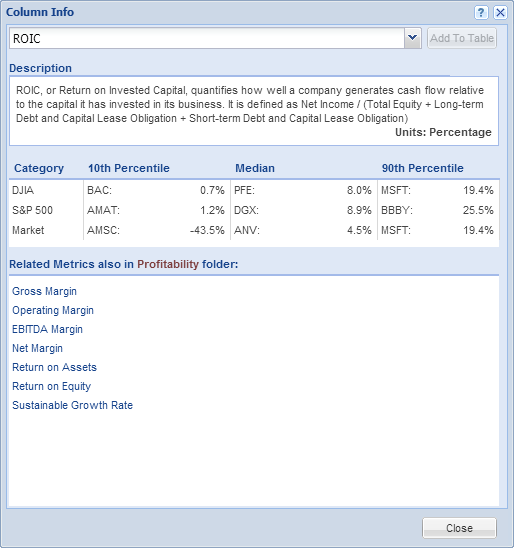
You can add either of the two new metrics to any of the Views through the View managers, or by clicking ‘Add Column’ in the Table’s toolbar and using the search box.
There are a few other very minor changes that you may see—the icons for the items in the Navigation panel have changed slightly, for example—but that’s about it. We hope you enjoy the changes. Don’t hesitate to let us know what you think by clicking the Feedback button in the top-right corner, or by emailingsupport@stockrover.com
Top