Investing in Today's Market - Part 2
 Printer Friendly
This is part two of a two-part series of blog posts based off the webinar of the same name from early November. In Part 1, we assessed the current market situation and concluded that there is no imminent danger of a recession, that the market is slightly expensive, and that interest rates will likely stay low until at least mid-2015, but probably longer. When interest rates do rise, it’ll likely have a negative effect of the economy, but with a buffer. Additionally, we determined that the sectors of Financials, Health, Discretionary, Industrials, and Tech would be good to own when rates do start to rise.
In this post, Part 2, we’ll use Stock Rover’s ranking screener (formerly called quant screening) to find some stocks that would be good long-term investment candidates.
Let’s Find Some Stocks
Overall, it looks like the long term investing environment is pretty good: the economy is picking up, interest rates are low, and we’ve got two cycles in our favor. Now, let’s find some stocks based on what we have learned. First, we will focus on Healthcare, Discretionary, Tech, and Industrials. We’ll also add in Financials because those stocks generally do well when rates rise, which we expect them to do sometime in the future.
For this example, we will look for companies that are growing their sales, their earnings, and their operating income; that are getting more efficient; and that are not relying on debt-financing for growth—this last one is because if rates rise, debt will become more expensive, which can negatively affect the company’s profitability. We’ve created a screener called “Long Term Growth” that embodies these factors. Below, I’ll list and briefly discuss the screener’s criteria.
Long-Term Growth Screeners
The first part of the screener that we’ll talk about is the filters: this is the part that knocks out stocks that don’t meet these criteria. The ranking part (discussed below) is what gives each stock a ranking based on how well they did. In this section I’ll go over the rationale for each group of criteria.
Preferred sectors: As we discussed in the Cycles section of the previous post, we are in the November to May period of the “Sell in May and Go Away” cycle, which tends to be stronger than the May to November period. Based on some analysis from a previous blog post, we’ve set this screener to select only stocks in sectors that historically were much stronger in this half of the year, and they are:
- Healthcare
- Discretionary
- Industrials
- Tech
- Financials
Size and Liquidity: Because small caps are doing poorly relative to mid and large cap these days, and because we are also wary of overvaluation (small caps tend to have higher valuations), we’re only going to select for mid to large cap stocks. (If you’re interested in small caps, check out our Finding Great Small Cap Stocks webinar.)
- Market cap > $2 Billion
- 250 or more employees (this ensures it’s a real company, not a holding company)
- At least 25,000 shares traded per day (this ensures there’s liquidity in the stock)
Debt and Efficiency: Because in this example we’re interested in fundamentally strong companies that are suitable for long-term investments, we want to make sure the passing stocks’ debt is not increasing, that the business is getting better, and that they’re not diluting their shares.
- Long-term debt/total capital not increasing in each of last two years
- Net Margin improving each of the last 2 years
- Improving ROIC each of the last 2 years
- A share count increase of no more than 2% in over the last 2 years
Long-Term Growth Screener Rankings
Next, we have the ranked part of the screener, which allows Stock Rover to rank the stocks that pass the filter criteria above. Each passing stock is given a score that ranks it based on how it does in the following categories. Please note that ranked screening is a Premium feature of Stock Rover.
Valuation (35% weight): All of these metrics were weighted according to the percentages listed below, with lower values preferred. This means that given two stocks with identical values, the one with, for example, a lower EV/EBITDA would be ranked more highly.
- P/E (10%) – The Price/Earnings is the classic valuation measure, where stocks with a higher value are considered more expensive. We are looking for stocks that aren’t as expensive.
- EV/EBDITA (10%) – This is an alternate measure to P/E, but it factors in capital structure. Companies with more cash are rewarded with this metric, whereas companies with debt look less favorable.
- Forward P/E (5%) – This is based on analyst estimates for the future P/E.
- PEG Trailing (5%) – PEG stands for Price to Earnings Growth, and measures the P/E to historical growth. Ideally, growth would have been large compared to P/E, so we want this number to be smaller.
- PEG Forward (5%) – PEG is like PEG Trailing, but uses expected growth in the calculation.
Growth (35% weight): In the growth segment, we’re looking for stocks that are solidly growing with respect to sales, operating income, and EPS. All of the metrics below were weighted to select for higher values.
- 1-, 3- and 5-Year Sales Growth (10%) – There’s nothing to fancy going on here—stocks with higher sales growth were preferred.
- 1-, 3- and 5-Year Operating Income Growth (10%) – Operating income (also known as Earnings Before Interest and Tax—EBIT) measures how profitable the company’s core business is, so these criteria are meant to find the companies that are growing more profitable the fastest.
- 1-, 3- and 5-Year EPS growth (10%) – Another no-brainer, stocks that were growing their earnings fastest were preferred.
- EPS Next Year Change (5%) – In addition to historical growth, we wanted stocks that were also expected to keep up their earnings growth in the coming year.
Efficiency (20% weight): In this segment of the ranked screener, we’re ensuring we find stocks that are efficient compared to their peers. The weights select for stocks with higher values in the following metrics.
- Return on Assets vs. Industry (10%) – Return on Assets shows how effective the company is at generating income from its assets. These values can vary depending on the kind of company, so instead of ranking just on ROA, we look at the ROA compared to the average in its industry, which ensures that we find stocks that are efficient compared against their peers.
- Return on Equity vs. Industry (10%) – This is similar to ROA, except it includes financial leverage. Again, comparing against the industry, instead of by itself, allows the screener to rank stocks that are doing well in this measure in any industry.
Balance Sheet (10% weight): This segment looks at the strength of the balance sheet, and in particular ranks stocks more highly if they have a balance sheet that is more resilient to negative effects of rising interesting rates. Stocks with lower long-term debt to capital and a larger amount of cash are preferred with this ranking.
- Long Term Debt to Total Capital (5%)
- Net Cash as a % of Market Cap (5%) – Custom metric auto-imported from library
You can download this screener in the Stock Rover Library (note that this is a ranked screener with equations, which are features that are only available to Premium users). We’ve also created a watchlist with the 50 top-ranked stocks that passed the watchlist on Nov 5th, which you can download in the library as well. You could also run the ranked screener on one of your portfolios to see your stocks ranked by the ranking criteria. To do this, right-click the screener and select ‘Apply to Portfolio’ from the drop-down menu.
Long-Term Growth Screener Results
Once you’ve imported the Long Term Growth screener in your account (if you’re a Premium user), you can run the screener at any time to see which 50 stocks are ranked highest. If you mouseover the rank, you’ll be able to see the stock’s value for each criteria, as well as the percentile for the ranking criteria. Below you can see an example of the score for WDR, the top-ranking stock as December 12th, 2014.
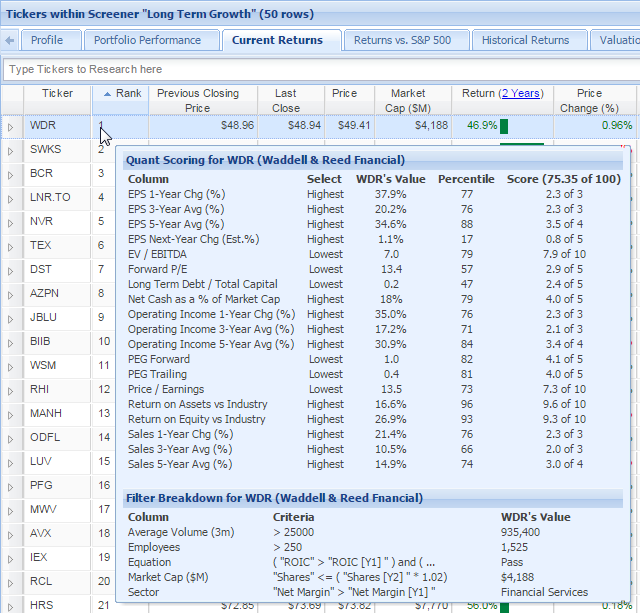
You can see that it not only passed all the criteria, but that it has consistently high percentiles across the board, which is why it’s come out on top.
If you are a Basic user, you won’t get the ranking but you can download the “Long Term Growth” watchlist from the Library to see the top 50 stocks as of November 5th 2014. We’ll occasionally run the screener and publish results so that you can compare the passing stocks over time.
Summary
Armed with our knowledge about our current investing environment, discussed in Part 1, we’ve assessed that it’s a favorable environment for long-term investors. We’ve built a Long Term Growth screener that looks for strong companies that are not overvalued. This screener is a strong starting off point to find solid companies on which we can do more in-depth research. As the economy and investing environment change, it is worth revisiting these economic principles in order to tweak your investing strategy.
Top