
Why Stock Rover
For the investor who does their own work. Screen the market, weigh the evidence and see how your real portfolio is doing, all in one place. We don’t make picks and we don’t promise outperformance; we make rigorous investing faster.
What the financial press says
“No other website packs as much useful, context-appropriate information onto a page.”
Named one of the best stock screeners
“To Research Stocks Fundamentally And Technically, Try This Website: Stock Rover”
“The wide range of information available makes it hard to compete with…”
The dashboard
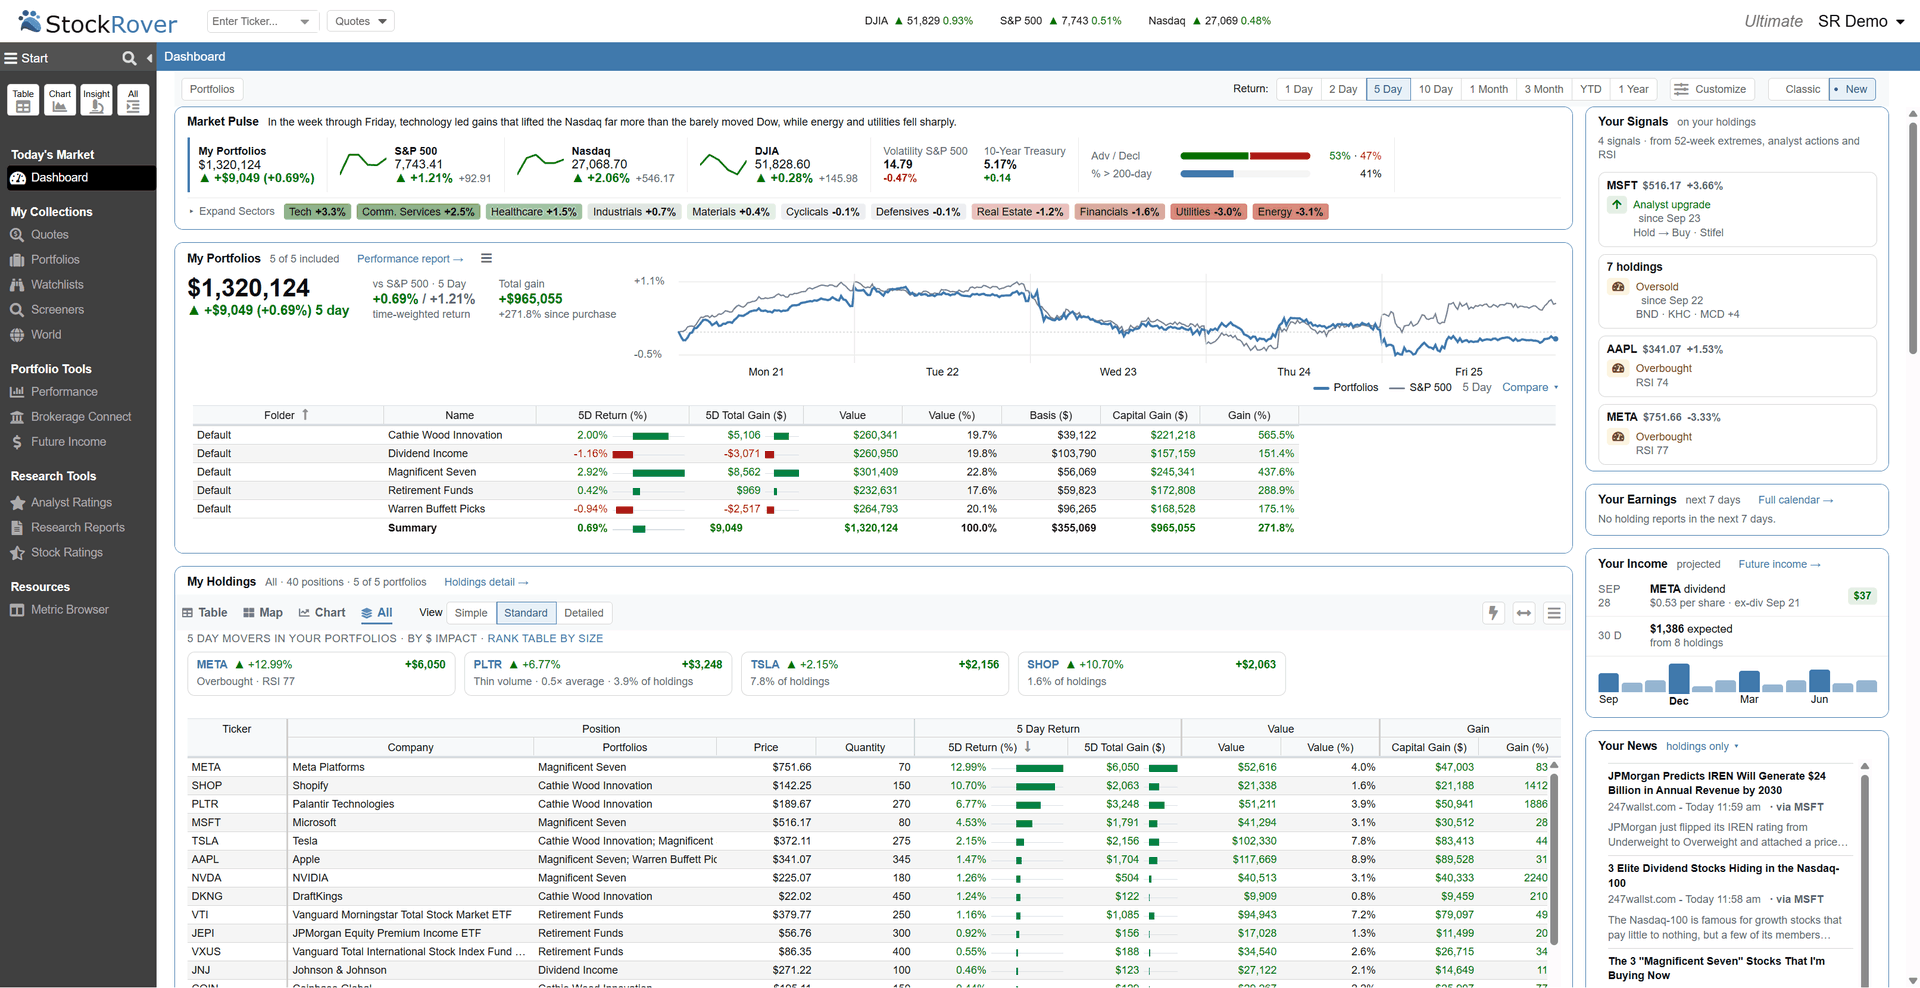
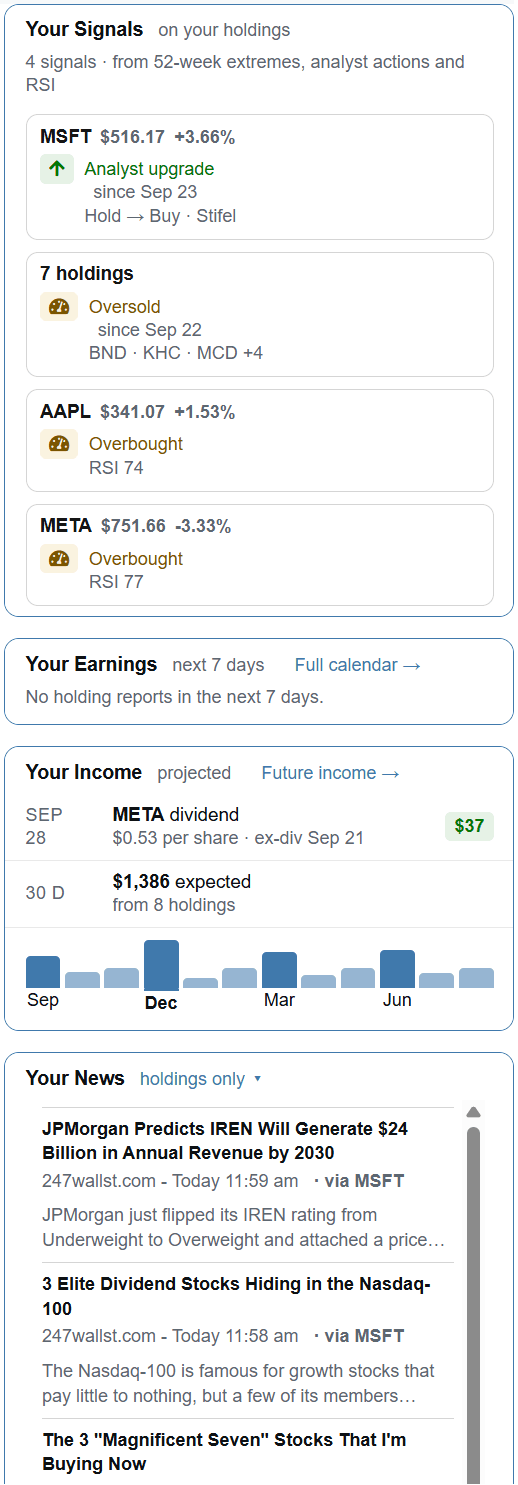
Open Stock Rover and the dashboard answers the first questions of the day: what the market is doing, what your portfolios did, which positions moved them and what needs your attention next. A side rail watches every holding for signals, earnings dates, upcoming dividends and news, so nothing that concerns what you own slips by.
The market in one sentence for the period you choose, then the numbers: your portfolios beside the major indices, volatility, the 10-year yield, breadth and every sector.
Total value and its change over your chosen period, time-weighted return against the S&P 500, and a line for each portfolio, one click from the full performance report.
The biggest movers ranked by dollar impact, then every position as a sortable table, a heat map or a chart against the S&P 500.
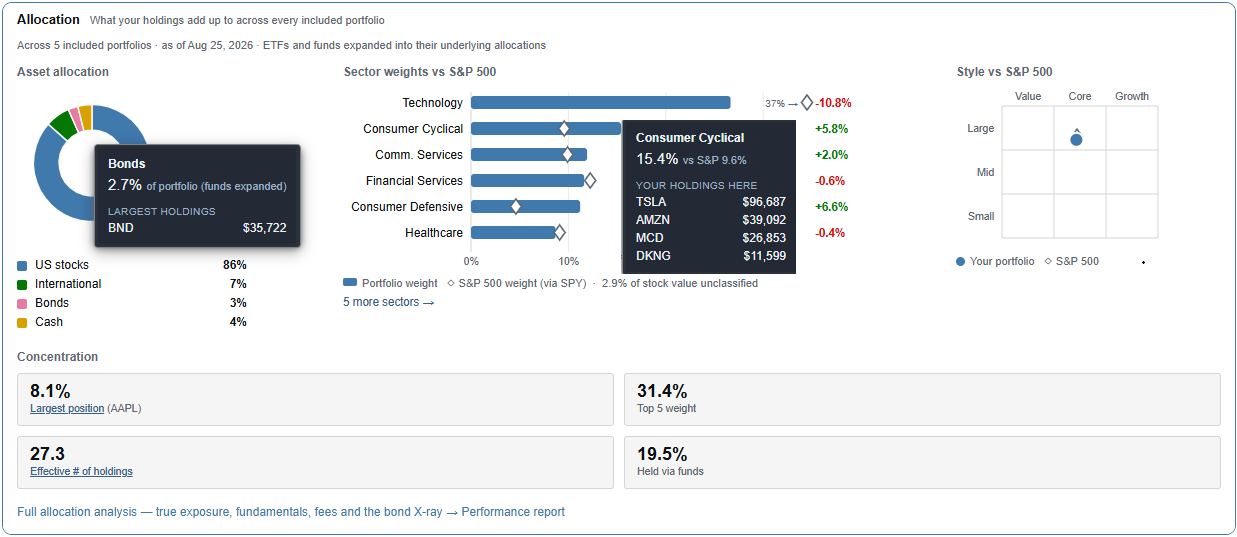
What your holdings add up to across every portfolio, with ETFs and funds expanded into what they own: sectors against the S&P 500, style and concentration.
Holdings at 52-week extremes, fresh analyst actions and oversold or overbought RSI readings, surfaced without building a screen.
Who reports in the next seven days, with estimates and beat streaks, and the dividends headed your way with a twelve-month projection.
Insider buying and selling, rating changes and price targets, filtered to the companies you own.
Headlines filtered to your holdings. Turn any module on or off with Customize and the dashboard becomes yours.
The research half
Skip the black-box algorithms and the stock tips. Four steps take you from 14,000+ North American stocks to a short list you understand, with the numbers checked before you risk a dollar.
1Step 1 · Screen
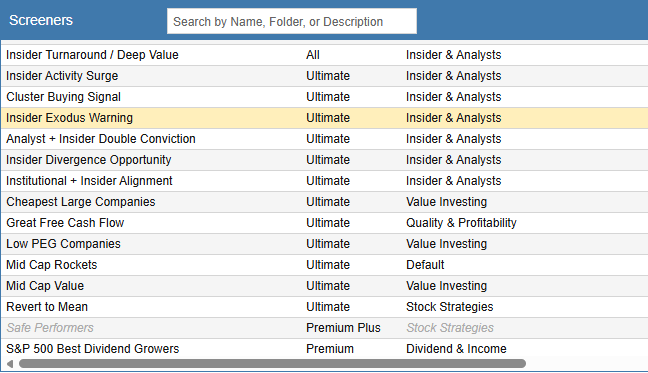
Start from 230+ ready-made screeners, from value, growth and dividend models to insider and analyst signals, or describe a screen in plain language and let the AI build it. Rank by weighted criteria or write your own equations to turn thousands of stocks into a short list.
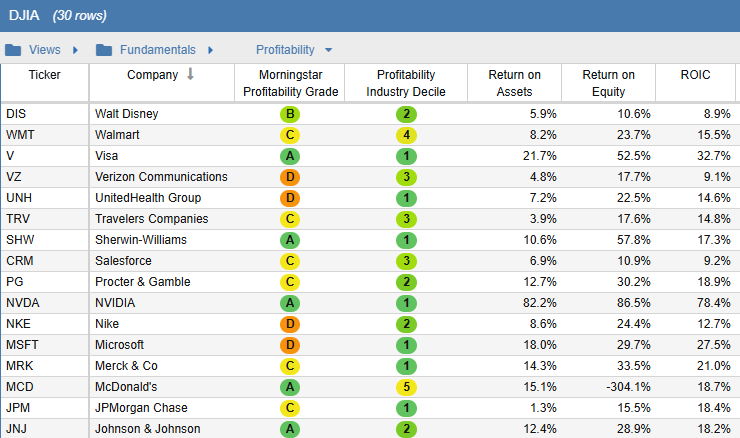
2Step 2 · Compare
Put your candidates side by side across hundreds of metrics, with grades and deciles that make the comparison readable at a glance. The Insight panel adds estimated fair value, margin of safety, six-factor percentile scores and Investor Warnings for every stock.
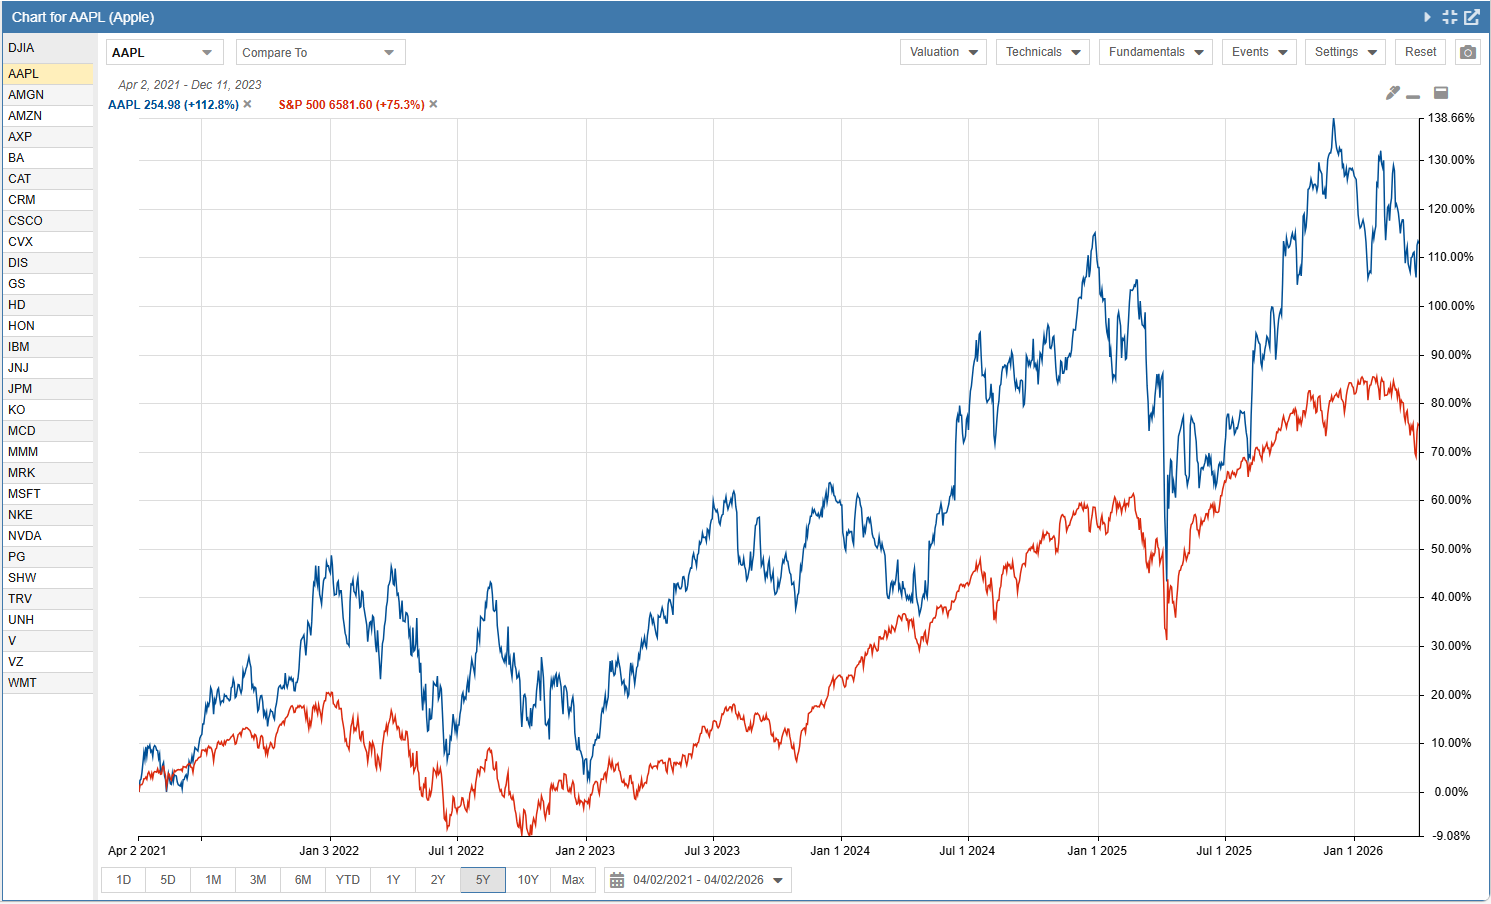
3Step 3 · Chart
Chart price against fundamentals, ratios and valuation ranges with up to 20 years of history, and benchmark stocks, ETFs and portfolios against each other on one canvas, to see whether today’s numbers are normal for the company.
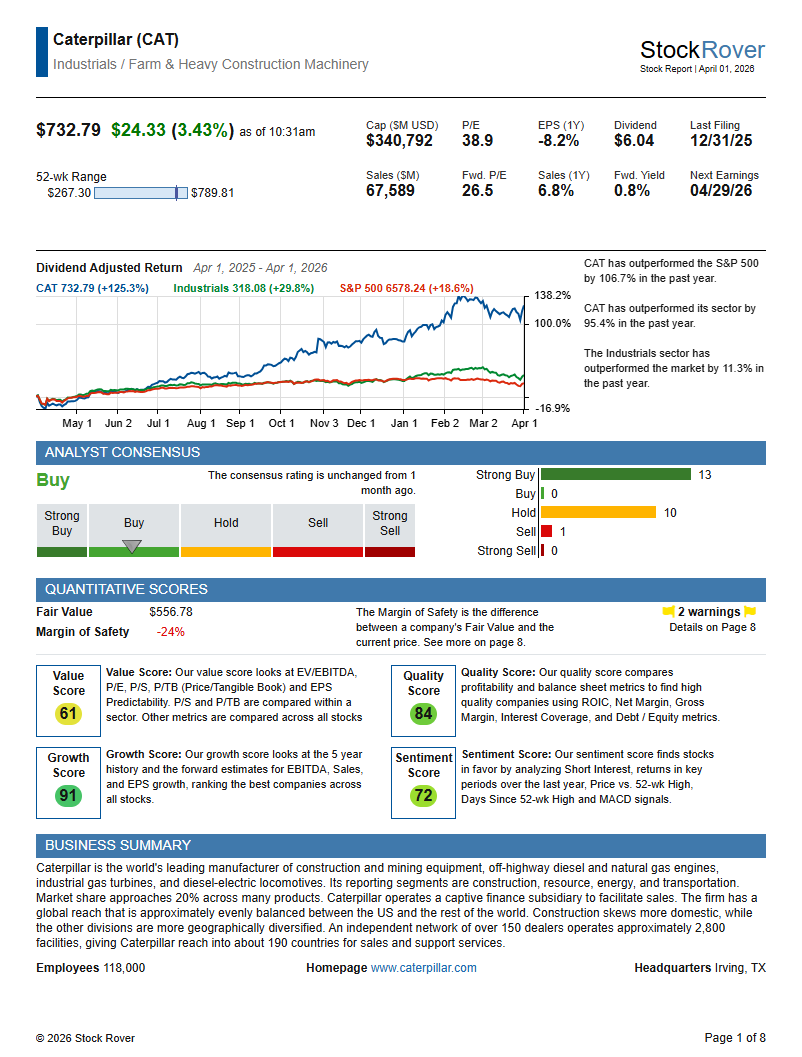
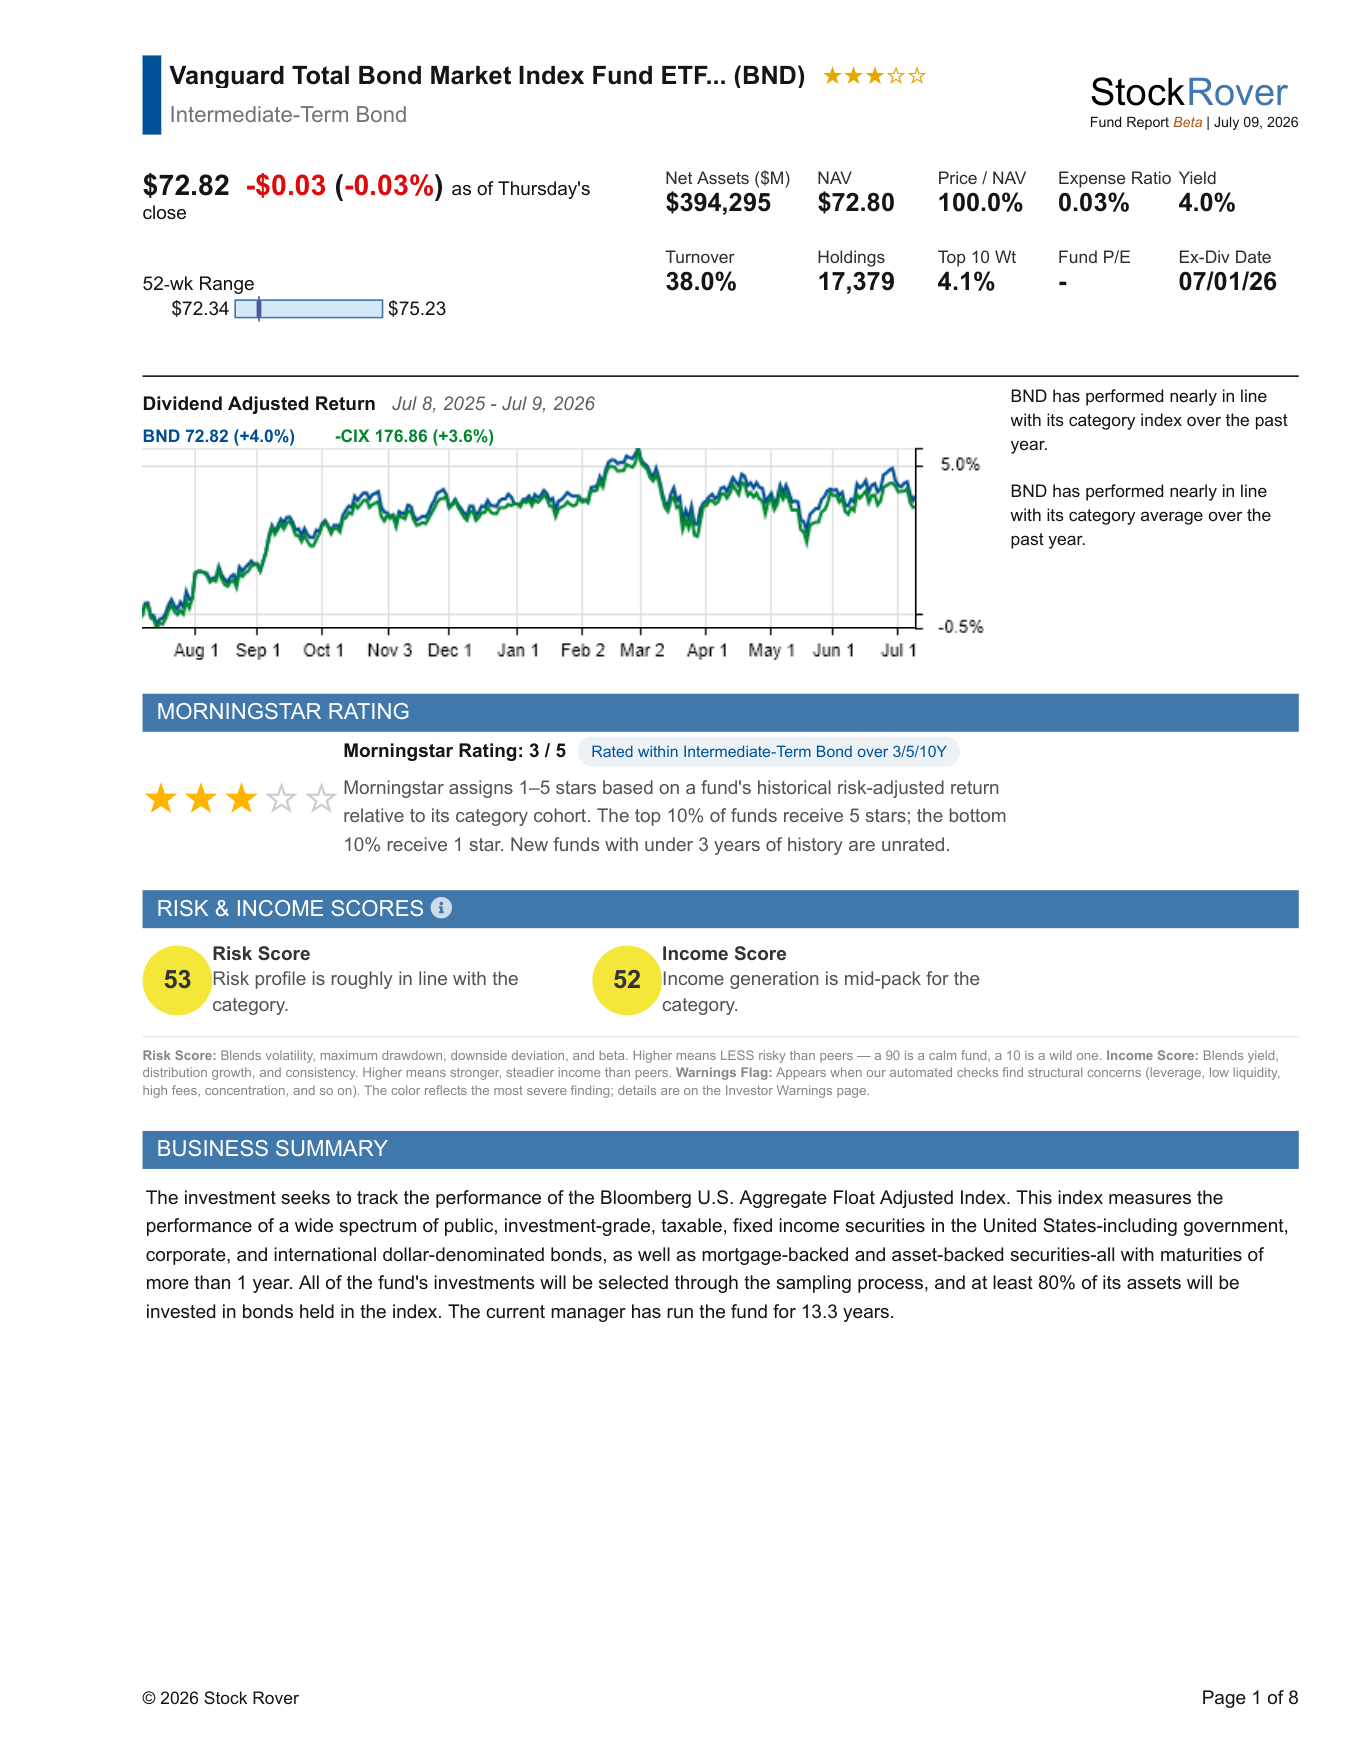
4Step 4 · Report
Generate an eight-page, print-ready research report on any of 7,000+ stocks, current to the day, from Premium Plus. ETFs and mutual funds get the same treatment: fund reports on 7,400 ETFs and 20,000 mutual funds cover ratings, risk and income scores, the 14 closest peers by composition and nine graded Investor Warnings, with full coverage on Ultimate and a sample set on every plan.
The portfolio half
Your brokerage statement tells you what you own. The Portfolio Performance Report tells you how it is going and why: what changed your balance, how much of that was your own money, and which positions carried the result or held it back, in dollars and in plain English.
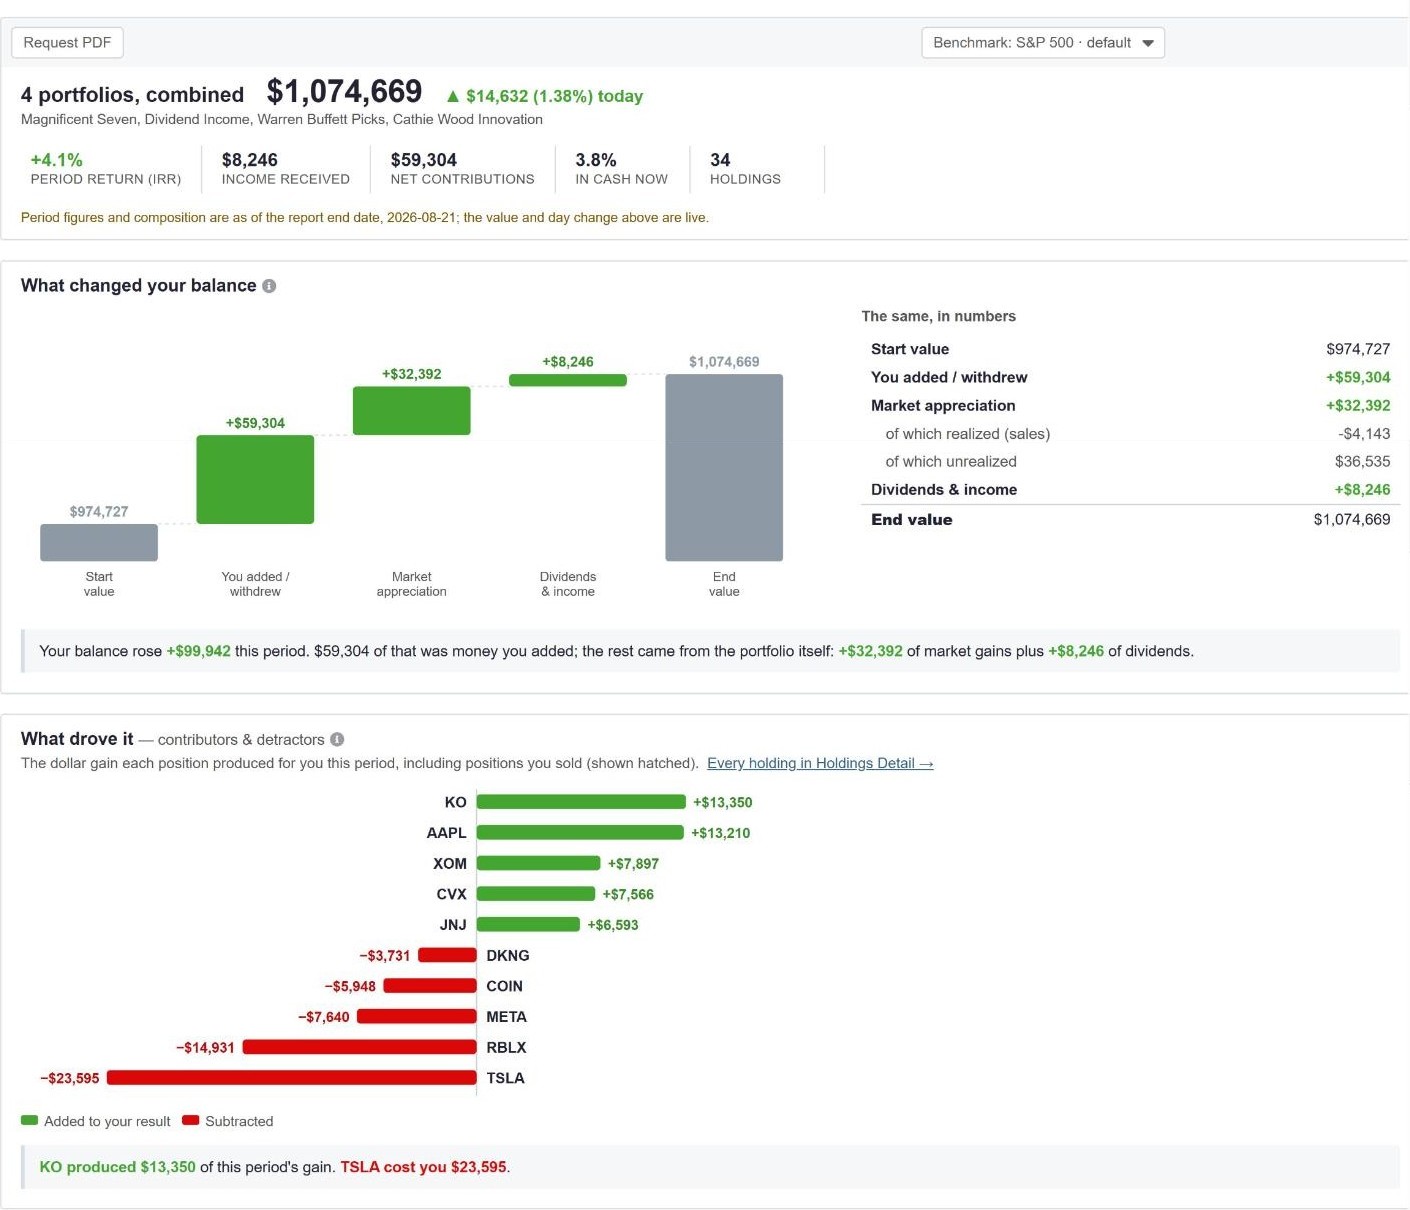
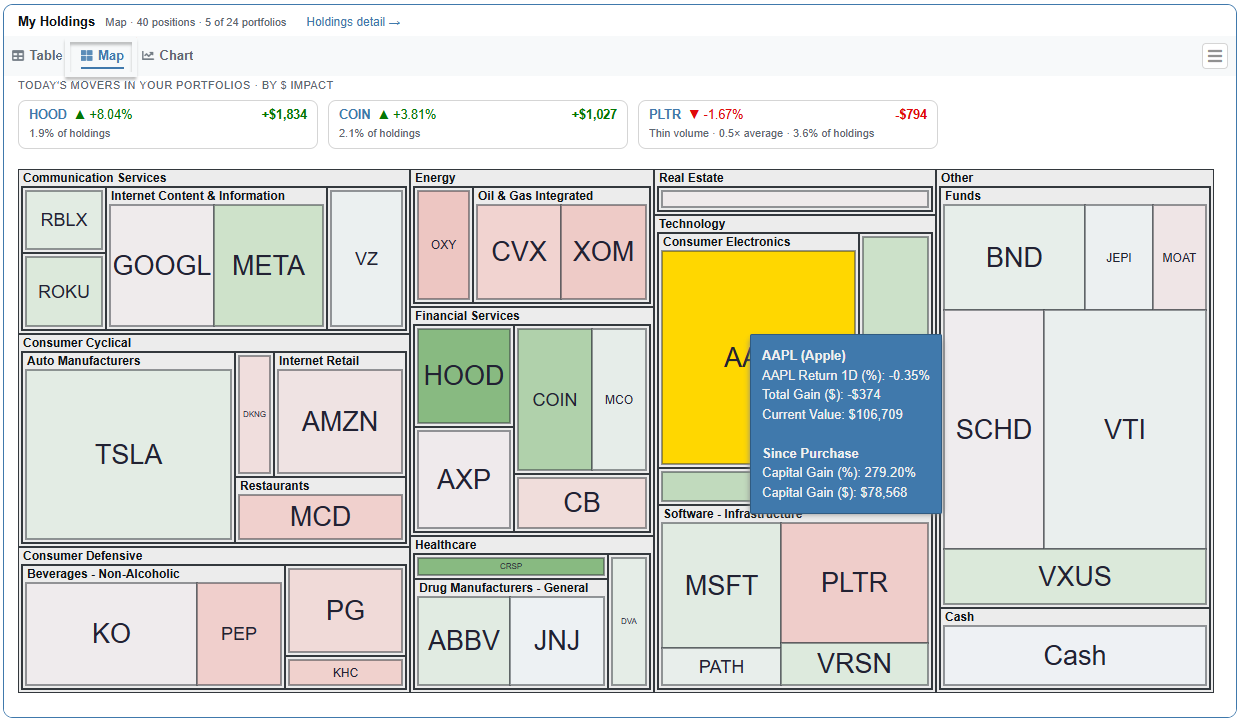
Link US and Canadian brokerages for one consolidated, dividend-adjusted view of everything you own, kept current automatically. Every tier includes the analytics: correlation, Sharpe, beta, volatility and drawdown, rebalancing that outputs exact trade lists, a Trade Evaluator and Monte Carlo planning.
Six solution guides show how the same toolkit serves different disciplines:
| Plan | Billed annually | Per year | Adds |
|---|---|---|---|
| Premium | $29/mo | $348 | Core screening (400+ metrics), portfolios and brokerage sync, 5-year fundamentals |
| Premium Plus | $49/mo | $588 | 700+ metrics, equations, valuation and ratio charts, 10-year history, custom metrics |
| Ultimate | $79/mo | $948 | 800+ metrics, 20-year history, fund reports, real-time quotes, analyst and options detail |
| Ultimate Pro | $149/mo | $1,788 | Professional limits: 1,000 screeners, 300 portfolios, 60 brokerage connections |
Monthly billing available on every plan. Premium Plus and Ultimate account for most new subscriptions; Premium Plus is the most popular plan, with Ultimate close behind. Full tier detail on Compare Plans.
Fourteen days, every feature, no credit card. Start on the dashboard, link your own accounts, run the performance report and read a report on a stock you know well, then judge the output against what you use today.
Weighing alternatives? How we Compare sets us against every major one by name. Tier gating and limits per the live Compare Plans table; see also plans & pricing.