
Stock Rover exists for the investor who does their own work. It puts the research (screening, fundamentals, ratings, reports) and the consequences (your real portfolios, measured properly) in one place, so the loop from idea to decision to verification runs in a single tool. We don’t make picks and we don’t promise outperformance; we make rigorous investing faster.
14 days · every feature · no credit card
What the financial press says
“No other website packs as much useful, context-appropriate information onto a page.”
Named one of the best stock screeners
“To Research Stocks Fundamentally And Technically, Try This Website: Stock Rover”
“The wide range of information available makes it hard to compete with…”
800+ metrics at the top tiers across 14,000+ North American stocks and 7,000 ETFs. A 150+ screener library (value, growth, dividend, guru and academic models) to start from; ranked screening with weights; equation screening across up to 20 years of history; percentile ranks against sector or index; and AI screener creation: describe the screen in plain language and Stock Rover finds or builds it.
The Insight panel puts two decades of statements, dividends, margins and returns behind every ticker. V12 added analyst ratings detail, insider transaction data, and option support: positions priced intraday with full greeks and chain detail. Estimated fair value and margin of safety, six-factor percentile scores and Investor Warnings frame every candidate.
Each research tool has its own deep dive:
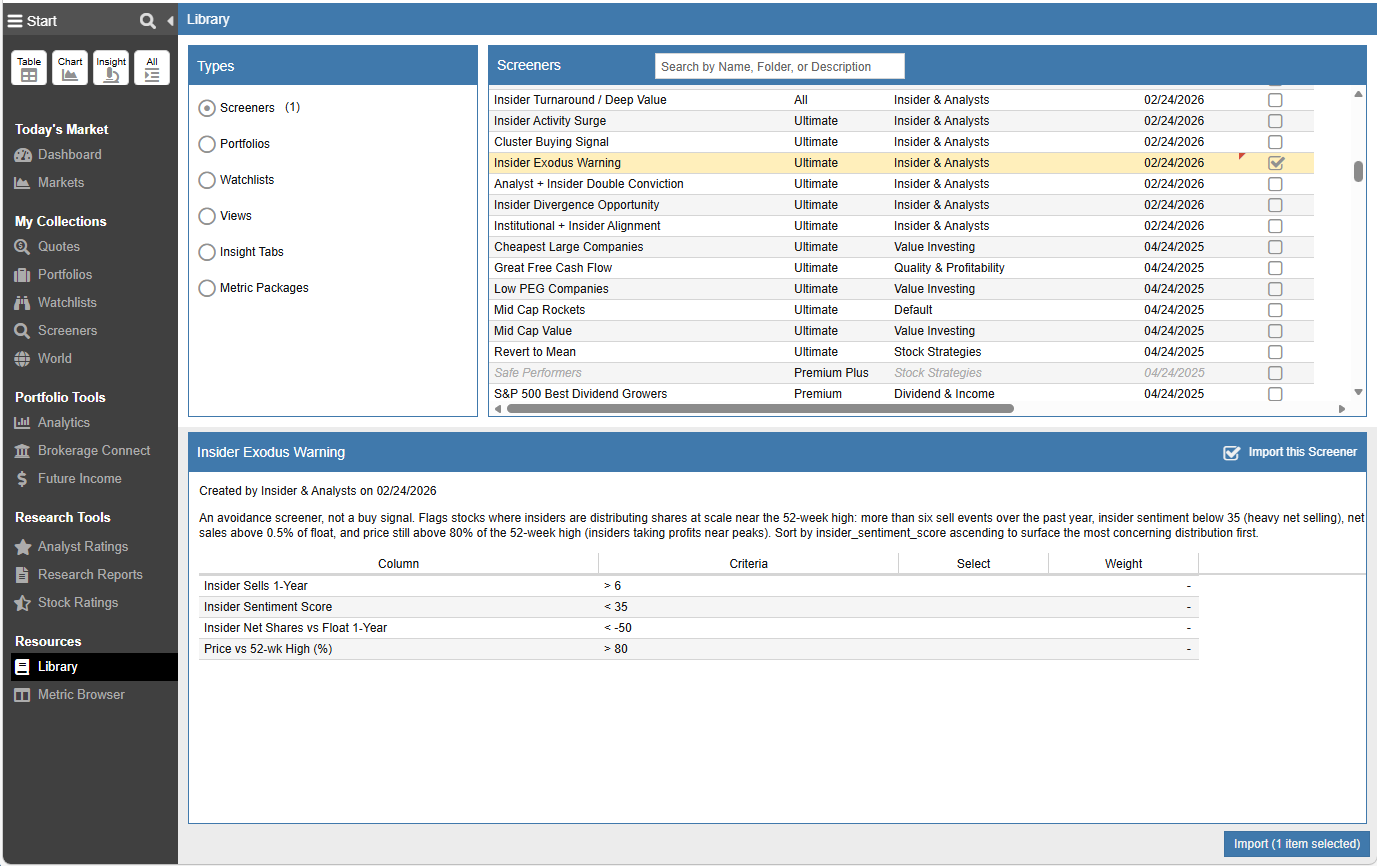
Find ideas faster: start from a 150+ screener library of value, growth, dividend, guru and academic models, add ranked or equation screening, or describe a screen in plain language and let the AI build it.
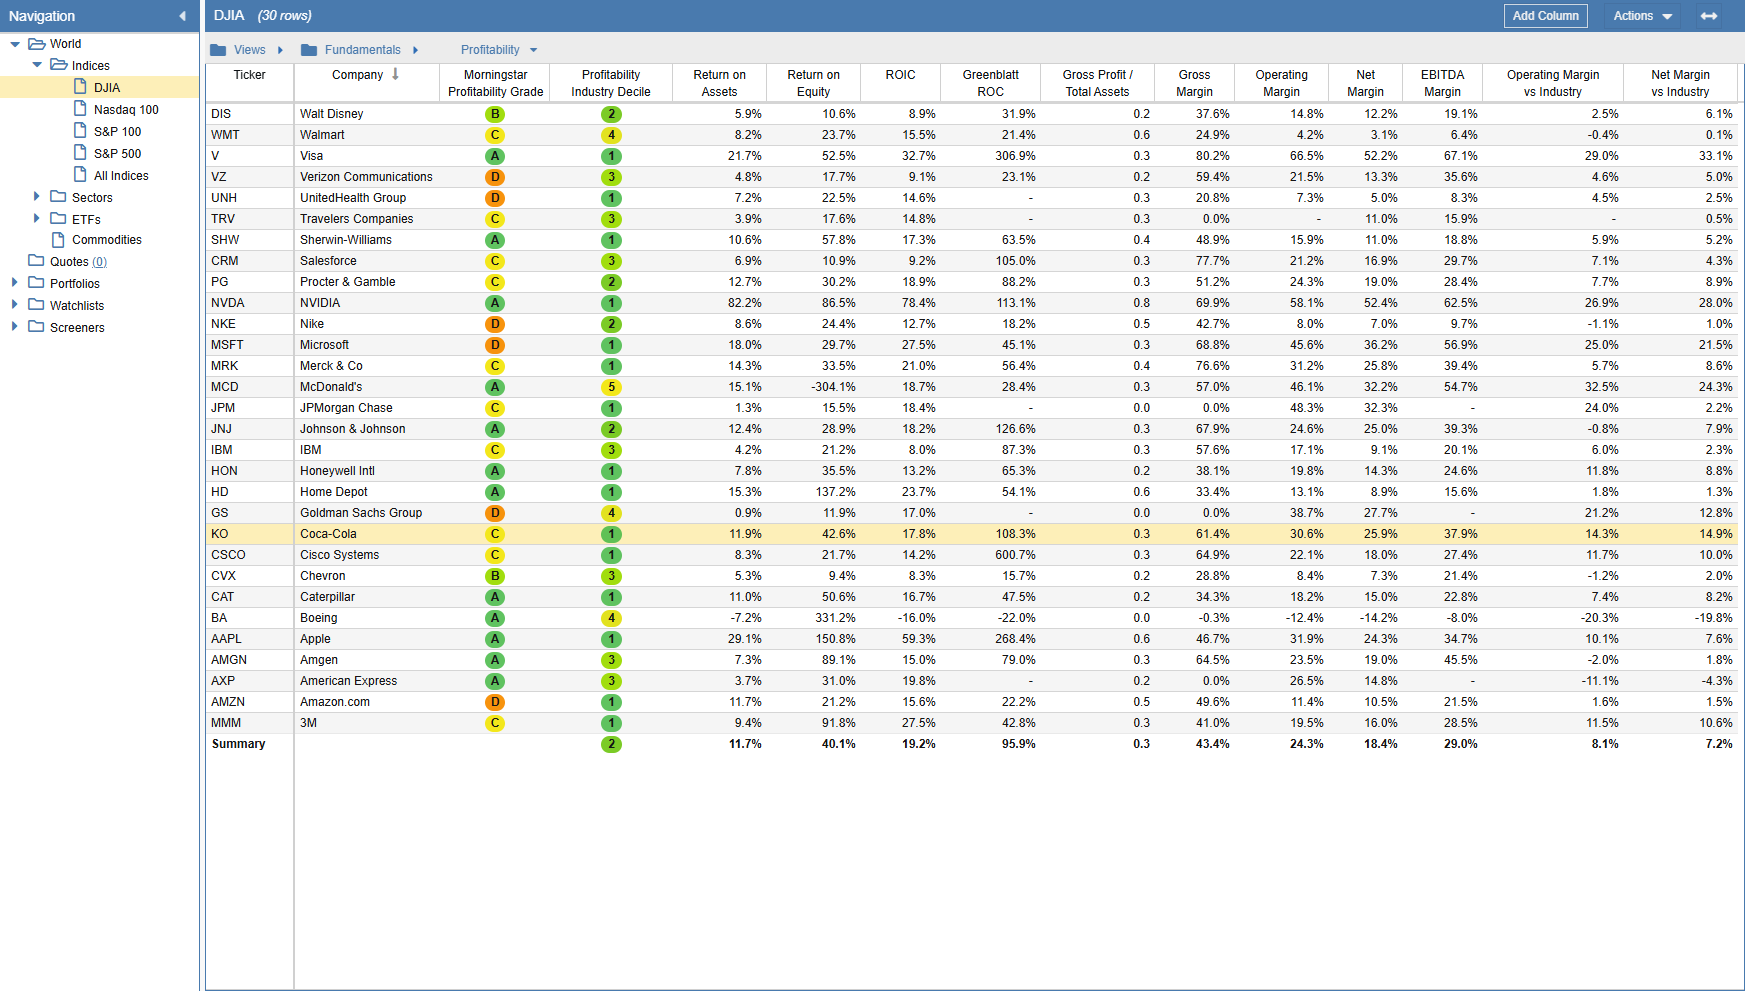
Line candidates up side by side across hundreds of metrics, with tables, tile views and the Insight panel turning raw numbers into a readable case.
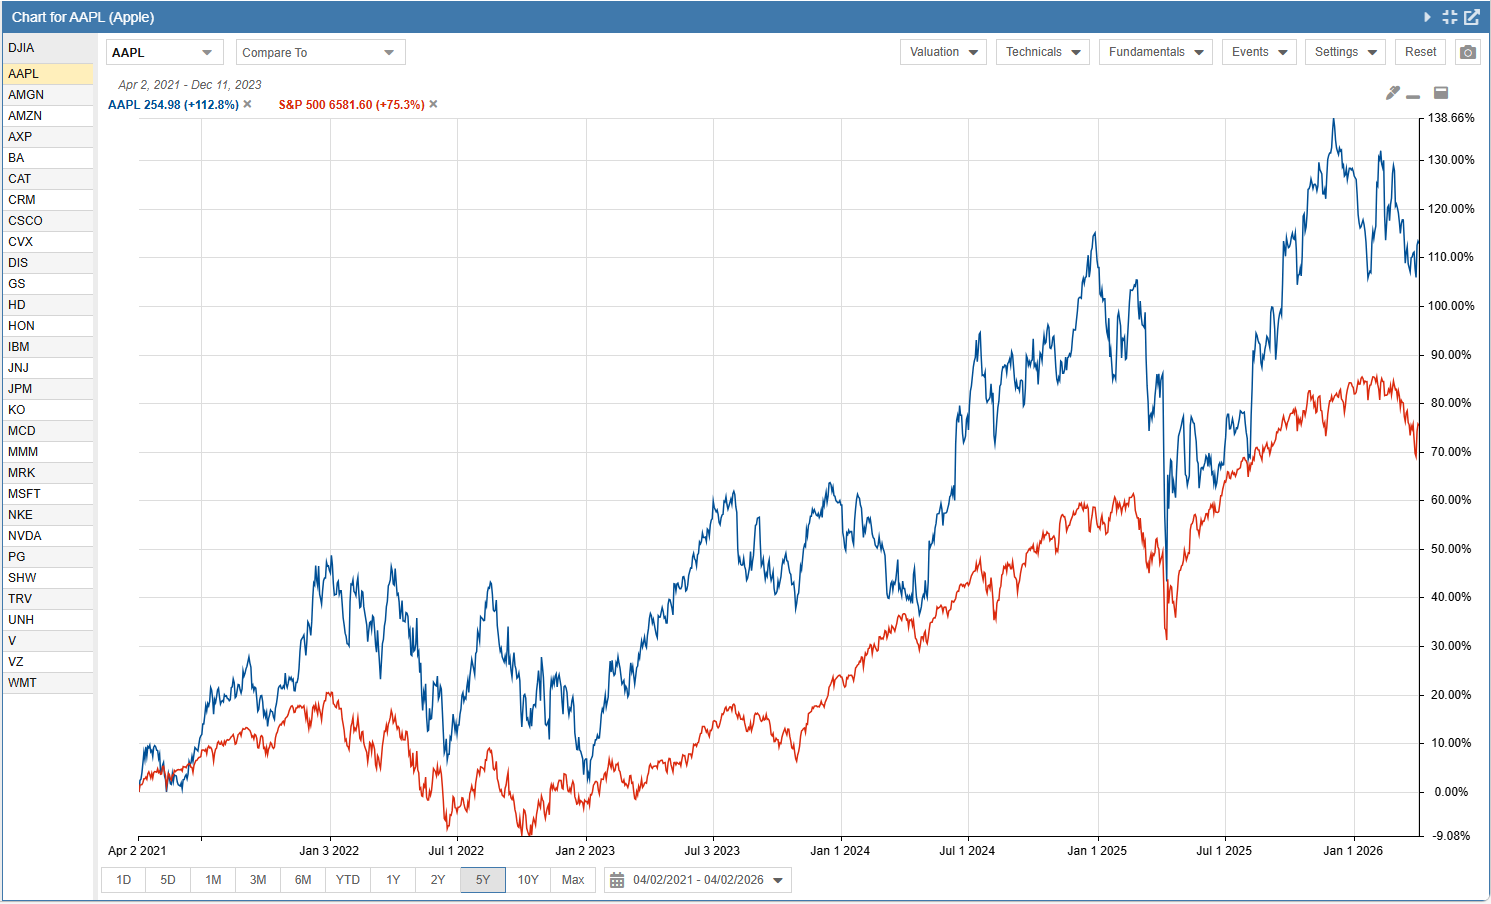
Chart price against fundamentals, ratios and valuation ranges, and benchmark stocks, ETFs and portfolios against each other on one canvas.
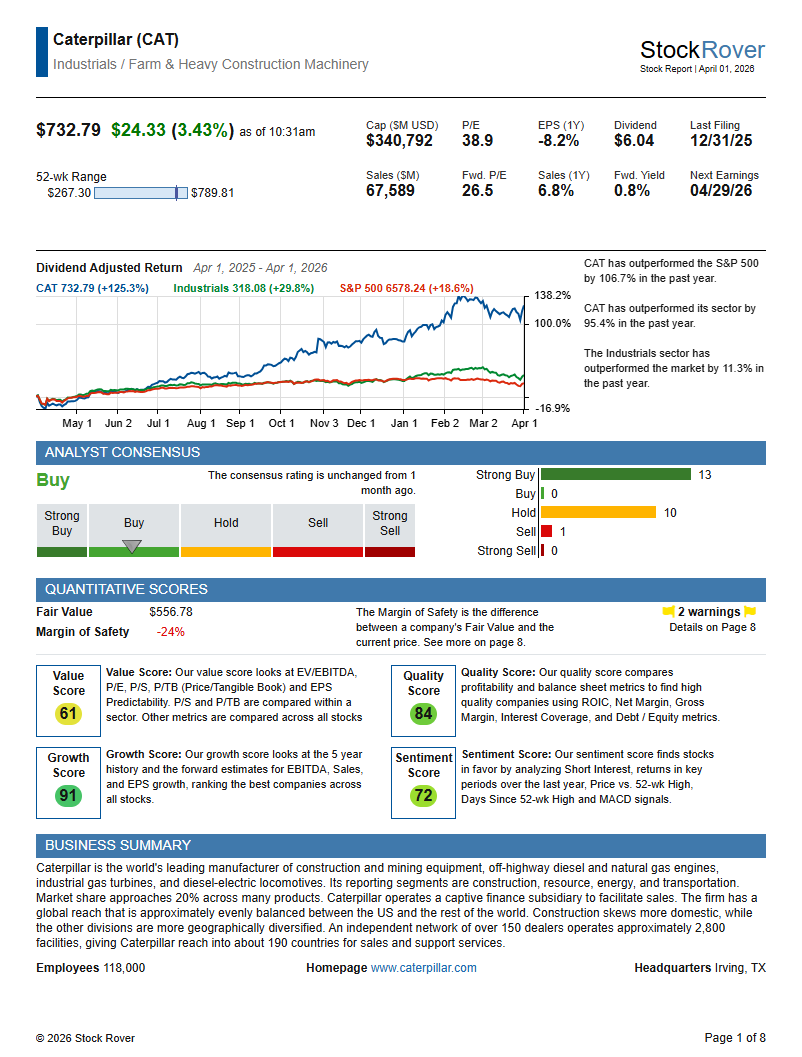
An eight-page, print-ready brief on any of 7,000+ stocks, generated on demand and current to the day. Included from Premium Plus.
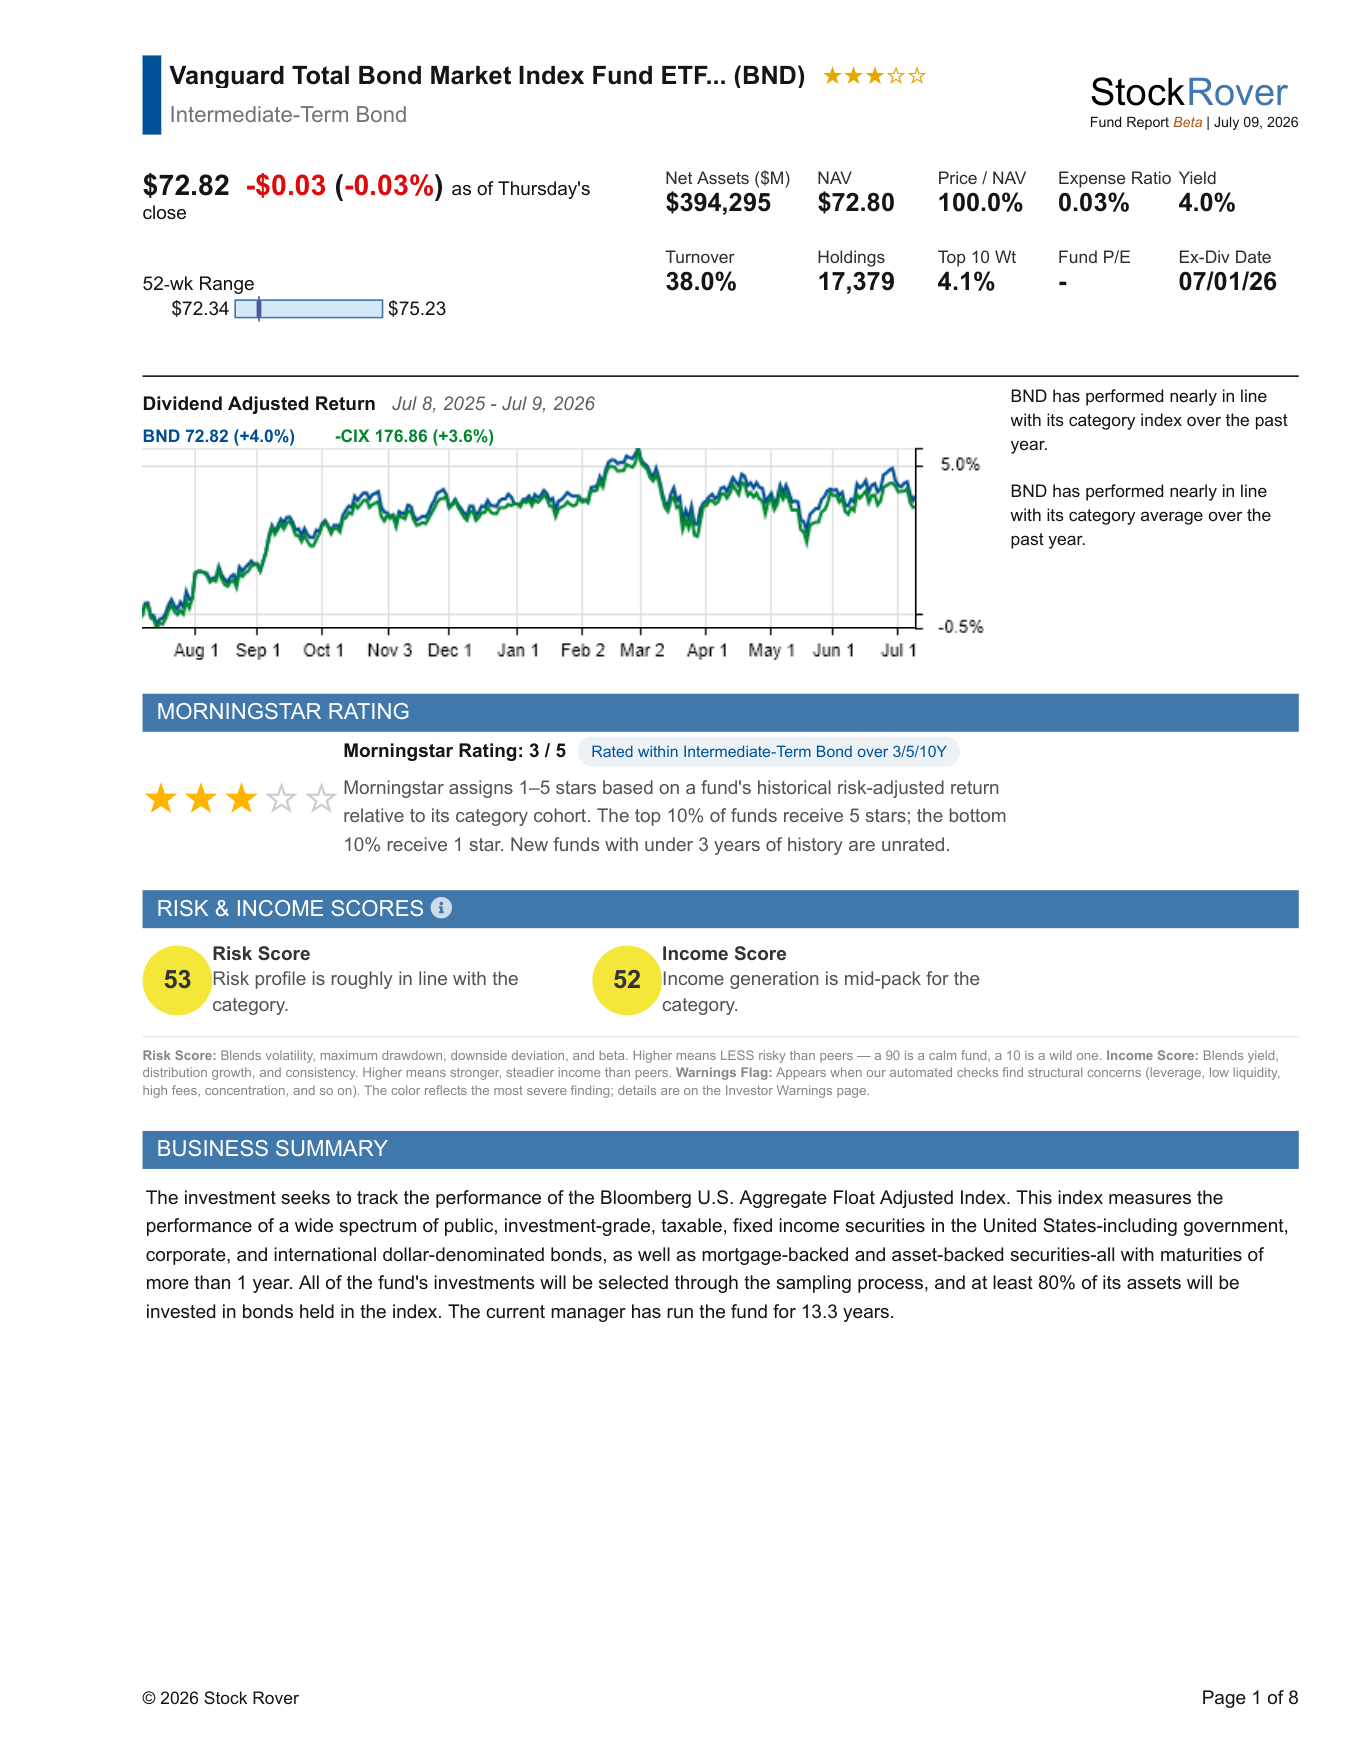
Fund research gets the same treatment: on-demand reports on 7,400 ETFs and 20,000 mutual funds covering ratings, risk and income scores, distribution analysis, the 14 closest peers by composition, and nine graded Investor Warnings. Full coverage comes with Ultimate; every plan includes a sample set.
Brokerage integration at every tier consolidates your real holdings into a dividend-adjusted record. The Portfolio Performance Report answers how it is actually going: IRR and time-weighted return stated side by side, risk against the S&P 500, projected dividend income by month, and fund fees in dollars.
Correlation, Sharpe, beta, volatility and drawdown; rebalancing that outputs exact trade lists; a Trade Evaluator that scores your decisions against the benchmark; Monte Carlo simulation for horizon planning. All of it on every tier.
Go deeper on the portfolio side:
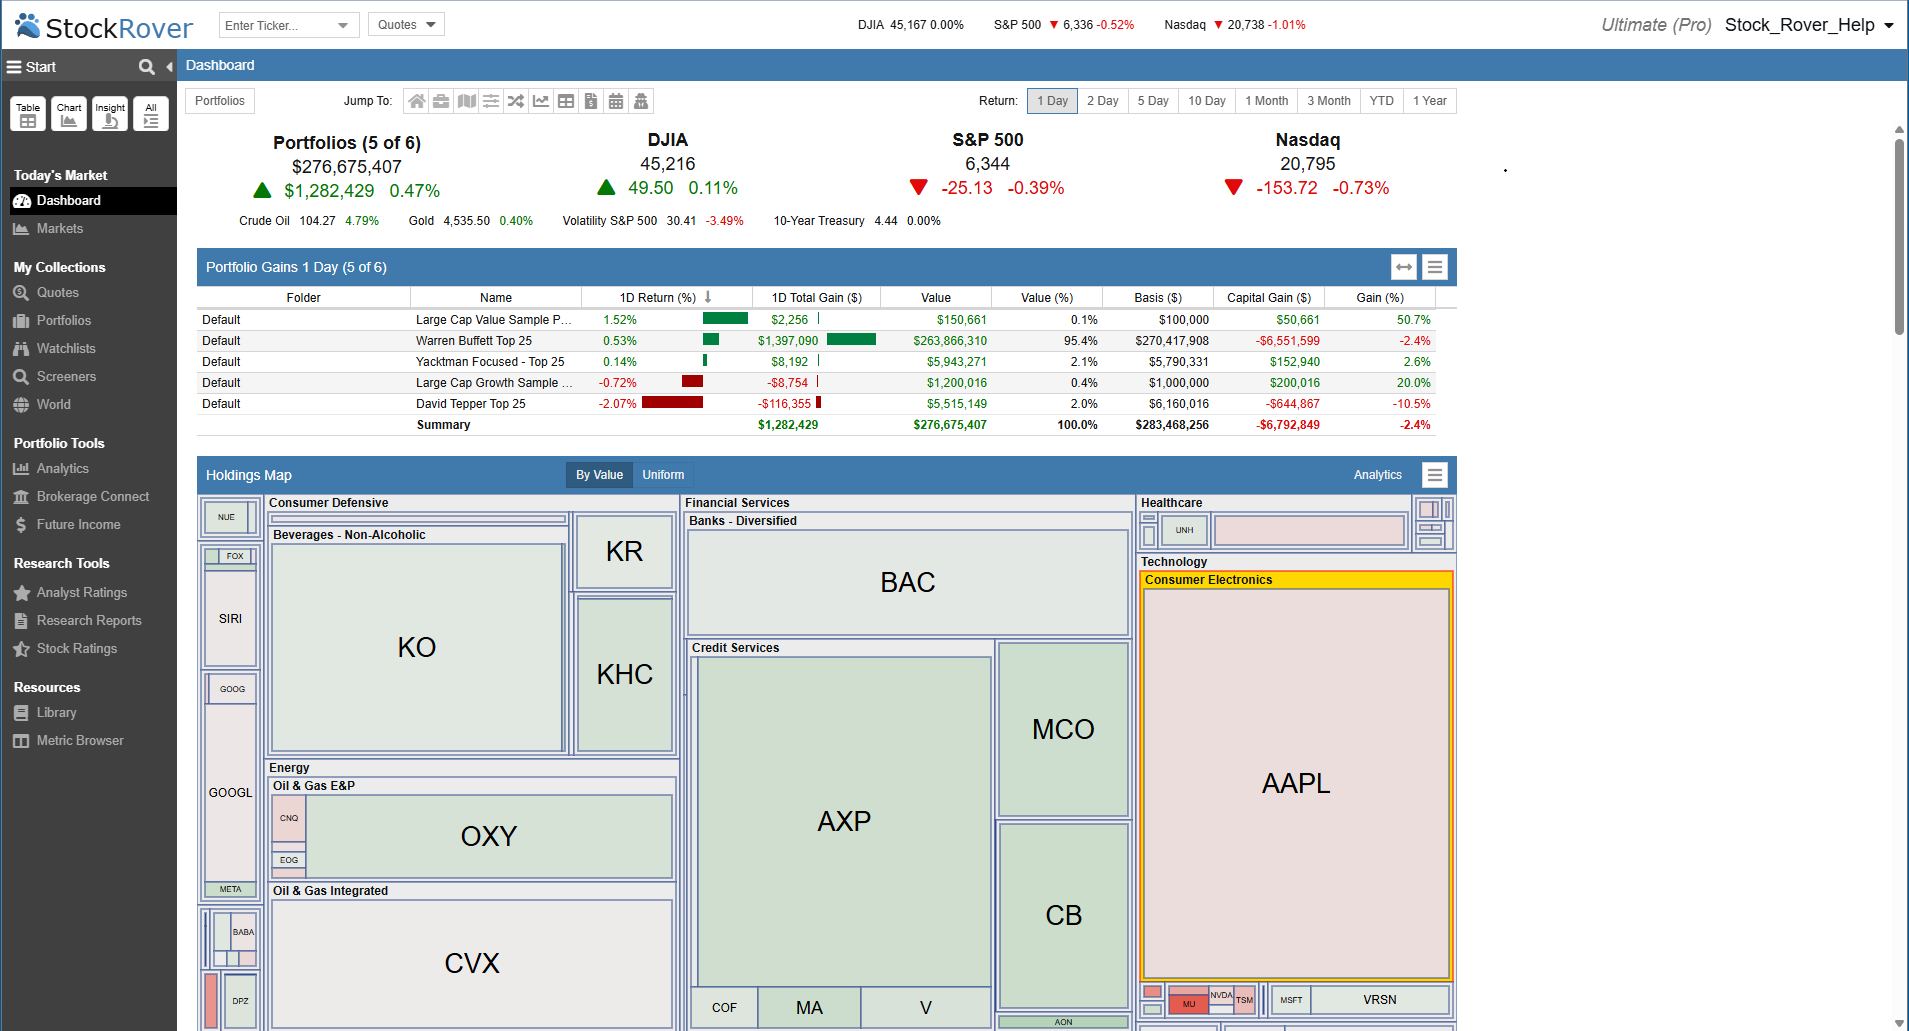
Link US and Canadian brokerages at every tier for one consolidated, dividend-adjusted view of everything you own, kept current automatically and measured with stated methodology.
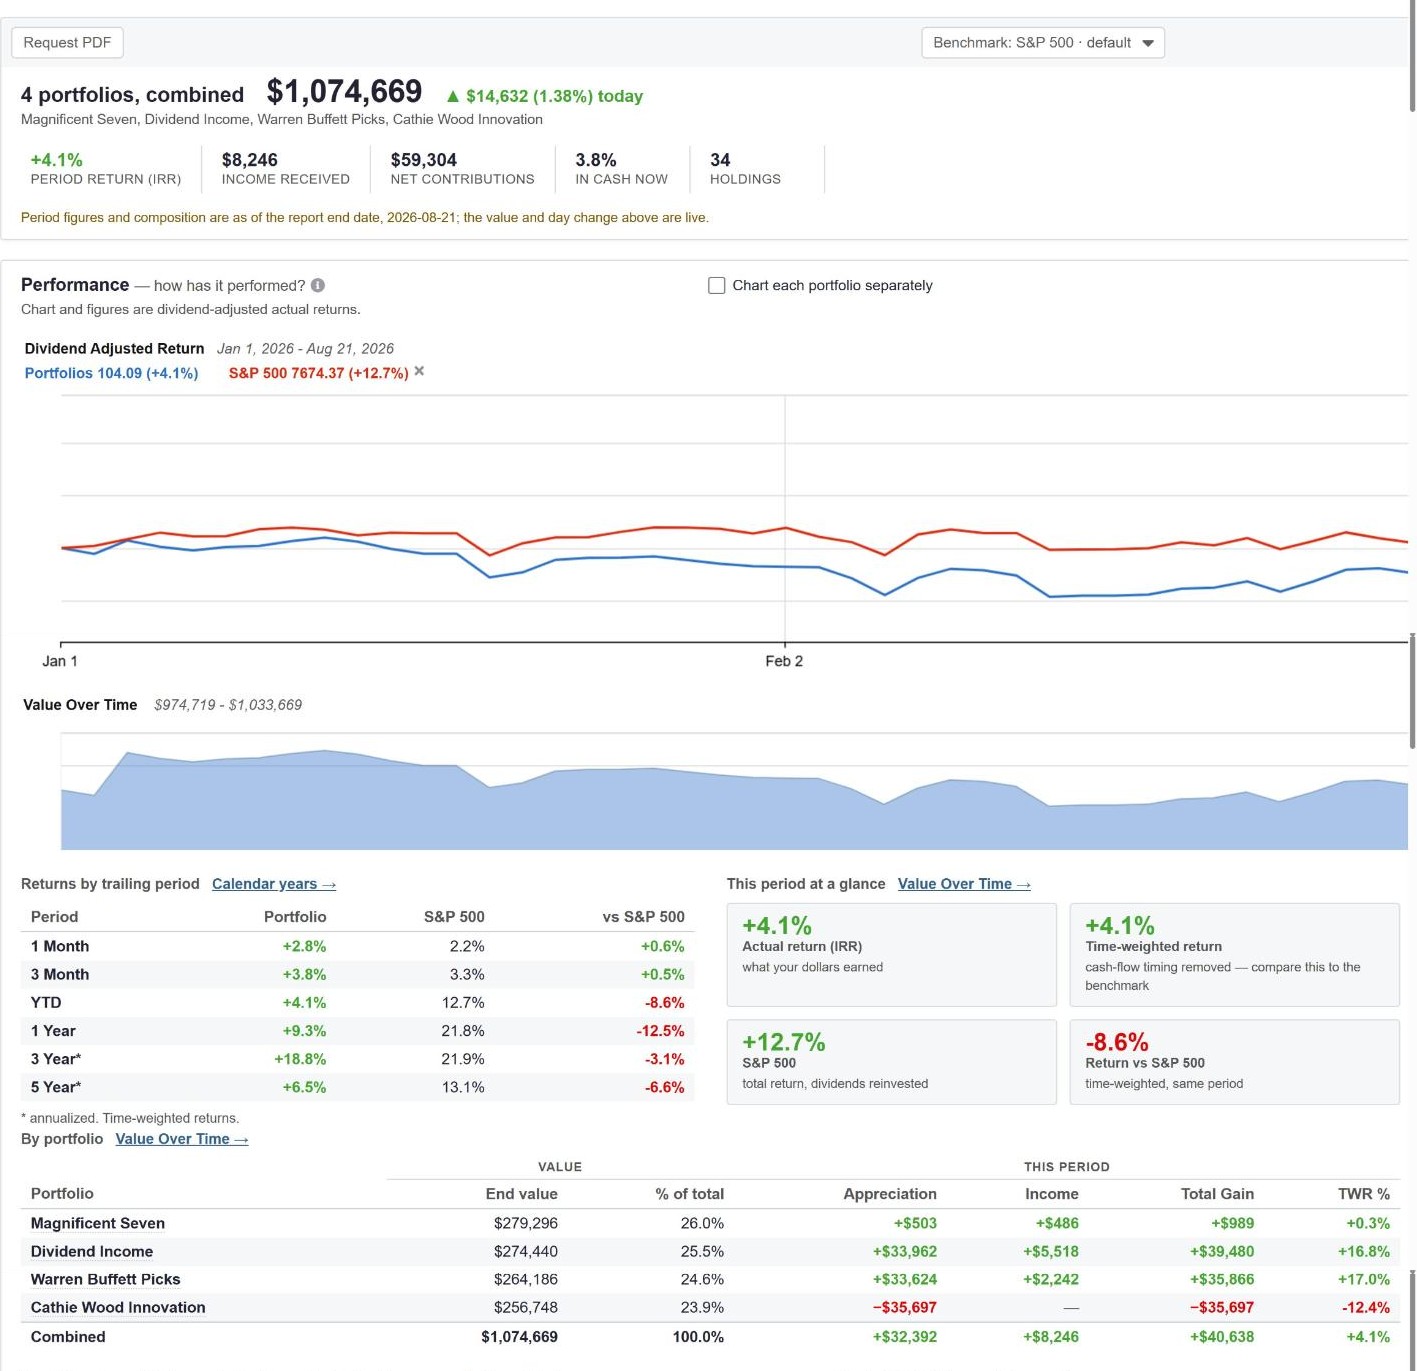
The report that answers how it is actually going: IRR and time-weighted returns side by side, risk versus the S&P 500, projected income by month and fees in dollars, on any combination of portfolios.
Six solution guides show how the same toolkit serves different disciplines: Portfolio, Value, Growth, Momentum, Dividend and Quantitative investing.
| Plan | Billed annually | Per year | Adds |
|---|---|---|---|
| Premium | $29/mo | $348 | Core screening (400+ metrics), portfolios and brokerage sync, 5-year fundamentals |
| Premium Plus | $49/mo | $588 | 700+ metrics, equations, valuation and ratio charts, 10-year history, custom metrics |
| Ultimate | $79/mo | $948 | 800+ metrics, 20-year history, fund reports, real-time quotes, analyst and options detail |
| Ultimate Pro | $149/mo | $1,788 | Professional limits: 1,000 screeners, 300 portfolios, 60 brokerage connections |
Monthly billing available on every plan. Premium Plus and Ultimate account for most new subscriptions; Premium Plus is the most popular plan, with Ultimate close behind. Full tier detail on Compare Plans.
It is for investors who verify: screeners, dividend and value disciplines, fund holders who read the fee line, anyone who wants their portfolio measured with stated methodology. It is not a trading platform (no order routing, no day-trade tracking), not a picks service, and North American by design, with deep US and Canadian coverage; if you need global listings or transcripts, our comparison pages name the tools that do that well.
The trial is the argument: 14 days, every feature, no credit card. Run your own portfolio through the report, run your own screens, read a report on a stock you know well, and judge the output against what you use today. How we Compare sets the same standard against every major alternative by name.
Link your accounts, run the report, screen your way. If it does not make your process faster, walk away with the trial.
Tier gating and limits per the live Compare Plans table. See also: How we Compare · plans & pricing.