
The short version: TradingView (roughly $14.95–$59.95/mo across tiers) is the best charting platform on the planet, with a social layer and global market coverage traders live inside.
Stock Rover is an investing platform: fundamentals up to 20 years deep, 800+ metric screening, fund research, and brokerage-synced portfolio reporting. Charts serve research here; they aren’t the product.
The one-line difference: TradingView is where you trade the chart. Stock Rover is where you own the business, and measure how that’s going.
| Capability | Stock Rover | TradingView |
|---|---|---|
| Price | $29–$79/mo billed annually | ~$14.95–$59.95/mo tiers |
| Free trial / tier | 14 days full, no credit card | Free tier with ads/limits |
| Charting | Functional research charts, ratio & fundamental overlays | Best in class, period |
| Community / social | ✗ | Massive ideas community |
| Global markets, crypto, forex, futures | US equities & funds; crypto quotes | ✓ everything |
| Fundamental data depth | up to 20 yrs, 800+ metrics | Present but thin; built for traders |
| Screening | Equation & percentile screening, historical | Good technical/basic fundamental filters |
| Brokerage sync & portfolio analytics | ✓ every tier + performance report | Broker integration for trading, not reporting |
| Fund & ETF research reports | 7,400 ETFs + 20,000 funds (Ultimate) | ✗ |
| Dividend research | 30 years + income projection | Basic |
| Alerts | Fundamental & screener alerts | Superb price/technical alerts |
TradingView shows headline financials; Stock Rover gives you the working dataset: 800+ metrics, up to 20 years deep, comparable across peers, screenable with equations and percentiles, chartable as ratios (price to FCF, EV/EBITDA through a cycle).
Brokerage sync at every tier plus the Portfolio Performance Report: IRR vs time-weighted return, what changed your balance, risk vs the S&P 500, dividend projection, fund fees. TradingView’s broker hooks are for placing trades, not accounting for them.
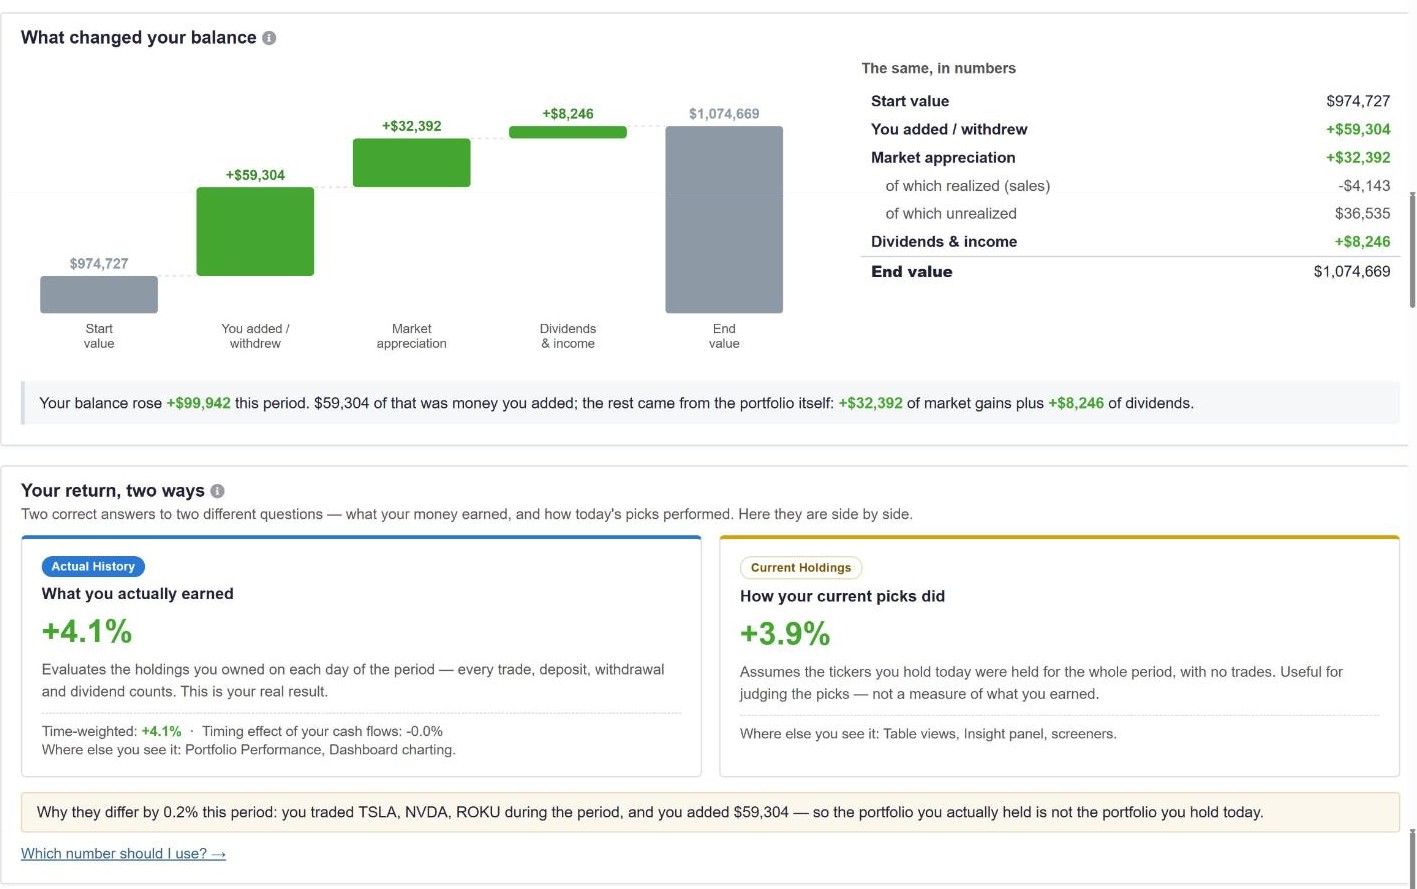
After the trade: what your money actually did, explained in plain English.
Most portfolios hold ETFs or mutual funds somewhere. Stock Rover researches 27,000+ of them (ratings, fees in dollars, look-through), a category TradingView doesn’t enter.
Charting: indicators, drawing tools, multi-timeframe work, replay: nothing else is close and Stock Rover doesn’t pretend to be. Coverage: global equities, crypto, forex, futures. Community: published ideas and scripts from millions of users. Price: entry tiers start under $15/mo. If you trade actively on technicals, TradingView is the right tool, full stop.
This is the “use both” pairing we see most often in our own subscriber base: TradingView for execution-grade charts, Stock Rover for research, screening and portfolio truth. The two barely overlap; that’s the point.
TradingView: traders, technicians, global/multi-asset watchers. Stock Rover: fundamental investors with real portfolios: Premium ($29/mo) up to Ultimate ($79/mo) as research needs deepen.
For fundamental research, screening depth, fund coverage and portfolio reporting: yes. For charting, community and multi-asset coverage: TradingView, and it isn’t close. They’re complements more than competitors.
TradingView connects to brokers for trading, but doesn’t produce trade-history-based performance reporting. Stock Rover syncs accounts at every tier and generates a full report: IRR vs TWR, risk, income projection, fund fees.
Good research charts: fundamentals over time, ratio charts, dividend-adjusted comparisons, 30-year dividend histories. For trading-grade technical charting, use TradingView.
If you pick one, Stock Rover: the fundamentals, screening and portfolio accounting are the daily tools of buy-and-hold investing. Many keep a free TradingView tab for charts.
Yes: 14 days, full-featured, no card.
Ten years of fundamentals and a full portfolio report, free for 14 days.
Maintained by Stock Rover. Facts last verified October 1, 2026. TradingView pricing from tradingview.com/pricing. Corrections welcome. See also: all comparisons · vs Finviz · plans & pricing.