Remember, Buy in November
 Printer Friendly
In May 2013, our CEO investigated the investing maxim “Sell in May, go away” by comparing the May-October returns to November-April returns over a period of 14 years, using ETF proxies for the market and sectors. What he found was that there was some truth to the old saw, although with some variability across sectors. Given that we are entering the November-April part of the cycle, we thought we could revisit this research and see what’s happened since then to identify any investing takeaways for the upcoming period.
First, to summarize some of the main findings of the original article:
- The November-April returns for the market were on average 3.4% better than the May-October period.
- The May-October period is historically more volatile, with lower lows, higher highs, and altogether swingier swings.
- Momentum seems to matter. In the rare years (3 out of 14) that the market went down in the November-April period, the following May-October period also went down. And the years when November-April was positive, then May-October was positive most of the time.
- The analysis of sector performance yielded a few modest takeaways for the May-October period, namely to overweight Staples and Utilities, and to underweight Financials and Healthcare. Tech is prone to bubbles, so it’s a sector than can be overweight in good times as long as you sell at the first sign of trouble.
You can read the full analysis and see the methodology here.
Since the original article was written at the top of a May-October period, it was mainly concerned with what to do at that part of the cycle. Now we are at the beginning of the other half of the cycle, plus have three additional years of data to analyze.
Remember, Buy in November?
If there was one major takeaway from that original article, it was that November-April yields on average better returns with less volatility than the other half of the year, so “Remember, buy in November” seems like a fair (if slightly less catchy) counterpart to “Sell in May, go away,” at least given the conclusions from the original article.
Let’s see what has happened since May 2013. Returns were positive in all years since then, and the May-October market returns were actually consistently better than the following November-April period. Below is a summary of returns for the S&P 500 proxy ETF SPY, including dividends. The November-April period ending in 2013 was very strong, so you see that positive momentum continuing into the May-October 2013 cycle:
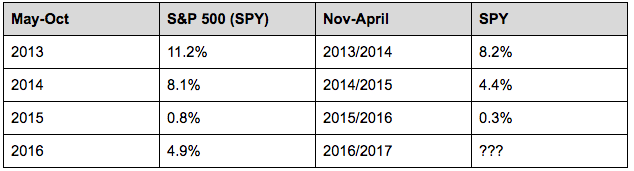
This is actually consistent with the original analysis, because the May-October period tends to be more volatile and have greater upside in good years. When you exclude the negative years from the past 17 years of returns (i.e., any year with at least one negative half of the cycle), the May-October period handily outperforms the November-April period.
Comparing Sectors
This volatility is also evident when we average the performance of the sector proxy ETFs (listed later in this article) for the past 3.5 years—in other words, assuming equal weight among all sectors and averaging their performance. This is shown in the following table.
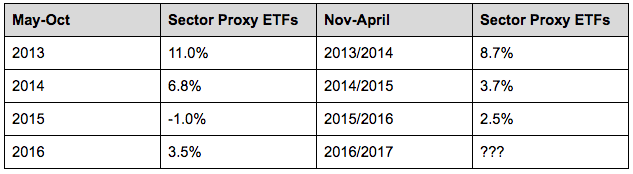
As you can see above, there are higher highs and lower lows for the May-October period over the November-April period in the equal-sector-weight scenario.
I also took the average return, median, minimum, maximum, and alpha for each sector ETF in the 2013-2016 dataset, and combined those values across the mutliple cycles. So, for example, the 5.1% mean return in the following table is the average of all the numbers in the second column in the above table. Here are those results:
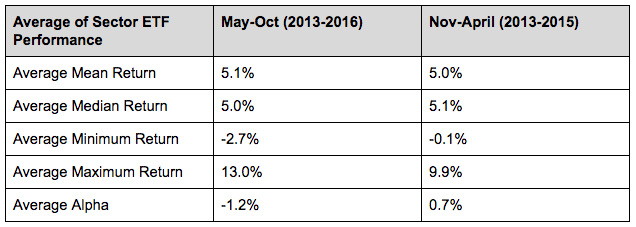
As you can see, the volatility is again greater in the May-October period, even though the mean and median for the two cycle halves were almost identical.
Interestingly, the average alpha in the equal-weighted sector scenario was greater in the November-April period than the May-October period. In other words, had you invested with an equal allocation in only the November-April periods between 2013 and now, you would have beaten the market; had you only invested (with equal allocation) in the May-October periods, you would have underperformed the market.
What this roughly tells us is that, for this sample period, hemming closer to the market allocation (see next image) is more favorable during the May-October period, at least during up years, while skewing toward an equal allocation among sectors provides better alpha during the November-April period. The following image shows the current allocation of the SPY fund used in this analysis. Because this is an index fund, its allocation is almost identical to the allocation of the S&P 500 index (note it includes two sectors not included in our analysis here, real estate and telecom).
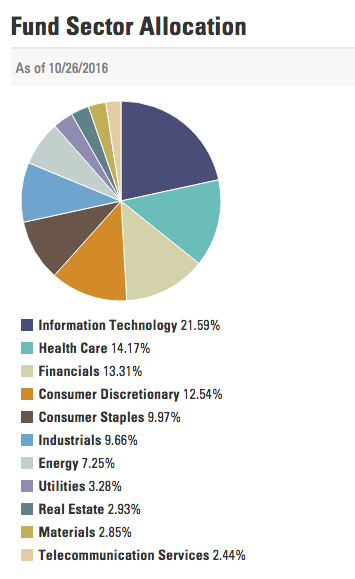
Source: State Street
Let’s see if we can refine that conclusion further by looking at the performance of the different sectors.
The next table shows the performance of the sector ETFs in the two periods (SPY is included for reference). I used color coding to differentiate between the different cycle halves. Here is the key for the sectors each ETF represents:
XLY: Discretionary AKA Consumer Cyclical
XLE: Energy
XLF: Financials
XLV: Health
XLI: Industrials
XLB: Basic Materials
XLP: Staples AKA Consumer Defensive
XLK: Tech
XLU: Utilities
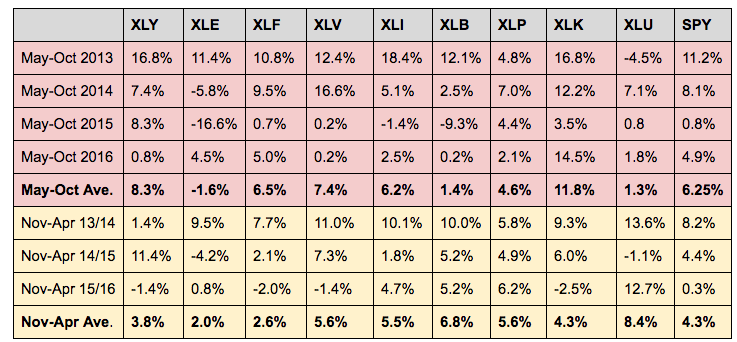
The sectors achieving alpha in the May-October period are Consumer Cyclical, Financials, Healthcare, and Tech. Aside from Tech, this departs from the findings in the original article. However, that article looked at a much longer time frame which happened to include two extraordinary periods in the market (the Dot-com bubble and Great Recession). When down market years are excluded, the only sectors that achieve alpha in both the 2000-2013 and 2013-2016 datasets for May-October are Tech and Consumer Cyclical.
How about the November-April period? The alpha achievers in the above table are Utilities, Basic Materials, Industrials, Healthcare, and Staples. This overlaps to some degree with the original dataset, where all of those but Staples achieved alpha, as well as Financials, Energy, and Consumer Cyclical. As determined earlier, an equal-sector-weight scenario during the November-April period achieves alpha—this is in large part because a lot more relative weight would be given to outperformers Utilities and Basic Materials, while less would be given to underperformer Tech (which has the largest allocation in SPY).
A few other observations. Energy had a strong performance in most years from 2000-2013, but it has had a very rough last few years. Either way, it is notably better in the November-April period compared with May-October.
Healthcare is also much stronger in the November-April period than May-October. In the last few years however we have seen a deterioration in performance, from being one of the top performing sectors in the 2013/2014 cycle to one of the worst performers in last year’s cycle.
The variable performance of the sectors throughout the years means there aren’t too many concrete footholds here, but at the very least this does support the original article’s conclusion to rotate/shift sector weights throughout the year.
Summary
What can we take away from all this? The last three-and-a-half years support the 2013 article’s conclusion that the November-April period on average produces better returns with less volatility than the May-October period, even if May-October offers better upside in the good years. So in other words, November is a good time in general to buy.
The most recent May-October period was positive, which could mean that momentum is on our side, although it’s not clear how much of an effect that will have. In the original article, momentum was seen transferring from the November-April period to the May-October period, but when I analyzed it the other way around, the pattern is less helpful. A positive May-October usually leads into a positive November-April, but not always, and with less magnitude (again, because May-October has greater upside in positive years).
Sectors can swing quite a lot so do your due diligence before shifting any capital around. Based on the historical patterns observed here, it would seem that allocating closer to an equal-sector-weight situation rather than market-weight could be a generally better approach for November-April. This means Utilities and Basic Materials get a greater slice of the pie for this period, while Tech is reduced.
Other macro factors, such as how the economy is faring and whether the market is overpriced, are probably more critical than historical May/November patterns (for more information on assessing the macro picture, see this article). And of course individual stock research is also extremely important. Nonetheless, there does appear to be some historical grounding to the old May-November saw, so considering using it as just one thread of information in a larger investment strategy.
Top