
The short version: Simply Wall St turns company analysis into pictures (the snowflake, the visual valuation bands) and is arguably the friendliest on-ramp in retail investing (Premium $131.40/yr, Unlimited $258/yr).
Stock Rover is the platform investors move to when they want the numbers behind the pictures: 800+ screening metrics, up to 20 years of history, unlimited research depth, and brokerage-synced portfolio reporting.
The one-line difference: Simply Wall St simplifies investing. Stock Rover equips it.
| Capability | Stock Rover | Simply Wall St |
|---|---|---|
| Price | $29–$79/mo ($348–$948/yr annual) | Premium $131.40/yr · Unlimited $258/yr |
| Free trial | 14 days, no credit card | Free tier (limited) |
| Beginner friendliness | Power-tool learning curve | Best in class |
| Company reports | Unlimited, data-dense | Capped: 5–30/month by tier |
| Screening | 800+ metrics, equations, percentiles | Simplified; ~10 saved screeners max |
| Fundamental history | up to 20 years | Shorter windows, visual-first |
| Global coverage | North American | Wide global markets |
| Brokerage sync | ✓ every tier | ✓ |
| Portfolio performance report | ✓ IRR, TWR, risk, income, fees | Visual portfolio analysis |
| Dividend history & forecasting | 30 years + projections | Basic dividend view |
| Fund & ETF research reports | 7,400 ETFs + 20,000 funds (Ultimate) | Stocks only |
Simply Wall St meters research at 5–30 company reports per month depending on tier. Stock Rover doesn’t meter: screen a thousand companies, open as many as you like, export what you need.
The snowflake compresses a company to five axes. Real theses are specific: “net cash, FCF yield above 6%, dividend growing 10 years straight.” That’s one equation screen in Stock Rover, ranked by percentile, alertable when new names qualify.
Both link brokerages. Stock Rover’s Portfolio Performance Report adds the accounting: IRR vs time-weighted return with the difference explained, contribution waterfall, risk vs the S&P 500, 12-month income projection, fund fees in dollars.
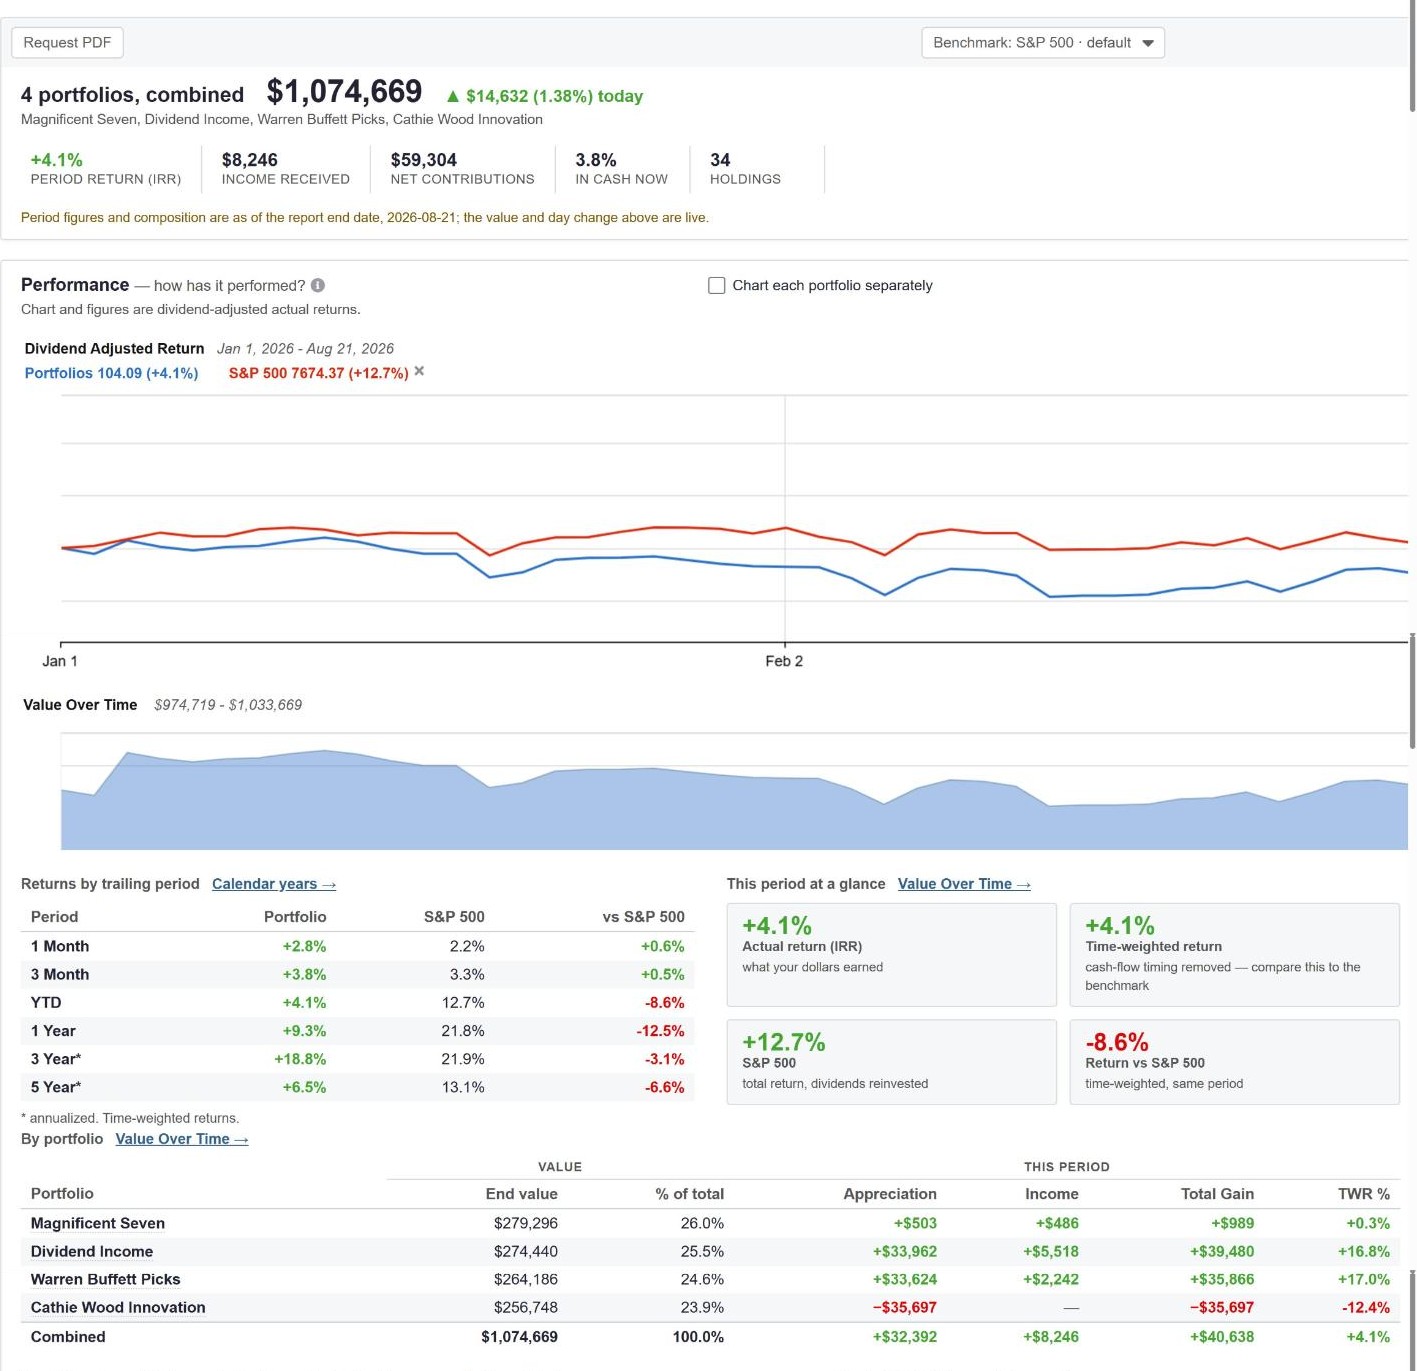
The report Simply Wall St graduates ask for: full performance accounting across every account.
Simply Wall St is stocks-only. Stock Rover’s Ultimate tier researches 7,400 ETFs and 20,000 mutual funds with fee and tax analytics, where most 401(k) money actually lives.
The on-ramp. Nothing makes a balance sheet approachable like the snowflake; for a first-year investor that’s not a gimmick, it’s pedagogy. Global markets coverage is broad at every tier. Design. It’s the best-looking product in the category, full stop. And at $131.40/yr, Premium is cheaper than any Stock Rover tier.
Newer investors who want guided, visual analysis of a moderate-size global portfolio, and anyone allergic to data tables.
Investors whose questions have outgrown five axes: Premium ($29/mo) for screening + sync; Premium Plus ($49/mo) for the full metric library; Ultimate ($79/mo) to add fund research.
For depth, yes: more metrics, longer history, unlimited reports, fund coverage, deeper portfolio analytics. For approachability and global breadth, Simply Wall St is better. They serve different stages of an investor’s life.
Company report views are capped by tier at roughly 5/month free and 30/month on paid tiers per their published plans. Stock Rover has no research caps at any tier.
No, it’s stocks-only. Stock Rover covers 27,000+ funds with research reports and fee analytics at the Ultimate tier.
Simply Wall St: $131.40/yr Premium, $258/yr Unlimited. Stock Rover: $348/yr Premium (annual billing) up to $948/yr Ultimate. Simply Wall St is cheaper; Stock Rover buys more capability per dollar as your needs deepen.
Yes: 14 days, full-featured, card-free.
Run your Simply Wall St holdings through 800+ metrics and a full performance report.
Maintained by Stock Rover. Facts last verified October 1, 2026. Simply Wall St pricing from simplywall.st/plans. Corrections welcome. See also: all comparisons · vs Koyfin · plans & pricing.