The exercises from Chapter X on portfolio construction are:
1. If you already have a stock portfolio, ask yourself these questions. If you don’t already own stocks, skip to #2.
- What stocks do you own?
- What percentage does each represent in your personal portfolio?
- How much dividend yield do you receive each quarter on your portfolio?
- What industry and sector do each of your stocks belong to? What is the sector and industry allocation within your portfolio?
2. Think about and write down answers to each of the following:
- How much do you want to invest?
- What is your tolerance for risk?
- What is your investing time horizon?
- How much do you want your portfolio to provide active income, versus longer term capital appreciation?
3. Now, what does this tell you about what kind of portfolio you should construct? Can you answer any of the following:
- On the spectrum of high growth/aggressive (on one end) to slow growth/conservative on the other end, about where do you want to be? What do you think might be a realistic portfolio growth target and why?
- How much total dividend yield do you want to acheive? Remember that a high yield often means flatter stock price performance.
- How much do you want to be invested in stocks, versus other asset classes?
- About how many stocks do you want to buy?
Only question #1 requires the use of Stock Rover. Here is where you can find the relevant information.
View Your Portfolio Holdings
First, you must link to, create, or import your portfolio to Stock Rover. Instructions are here:
If you want to analyze a sample portfolio, you can use the samples that come with your Stock Rover account, or choose from a variety of guru portfolios in the Library.
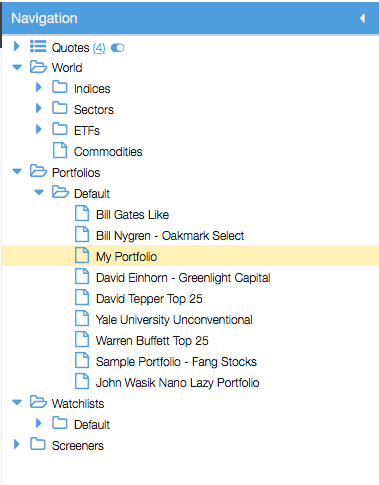
Once you have the portfolio you want to analyze loaded into your account, click on it in the Navigation panel (as below) on the left side of the screen to load it in the main Table.

The holdings will load in the main Table. You can then use the columns in the Portfolio Performance view tab and others views to see information about your portfolio holdings.
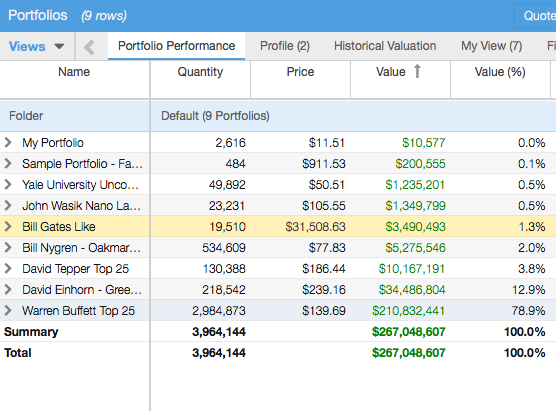
You can also click on the folder ‘Portfolios’ in the Navigation panel or in the Table header in order to see whole portfolios side by side, like this:

Find Sector Allocation
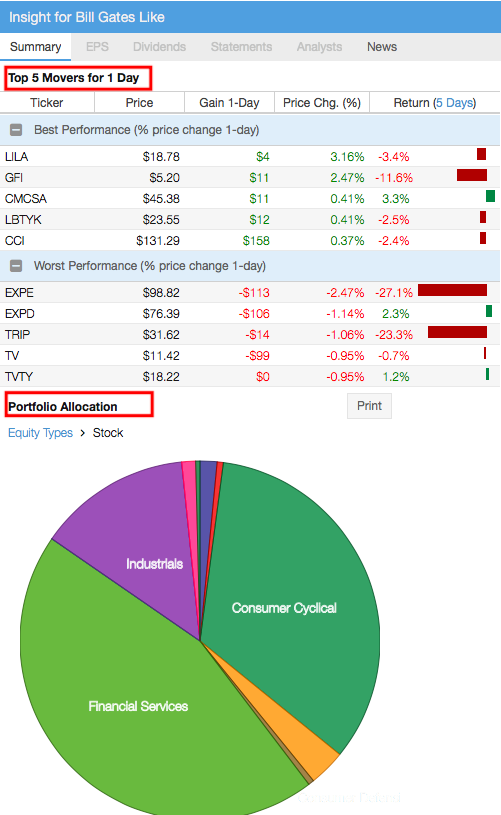
When you have a portfolio selected in the Table, as in the above image, the Summary tab of the Insight panel shows information about that portfolio, including an interactive sector allocation pie chart, top 5 movers, and an aggregated news feed for tickers in that portfolio. These items are boxed in red below.

The portfolio pie chart will also be visible at the bottom of the Summary tab when any individual stock from a portfolio is selected in the Table.
Find Industry Allocation
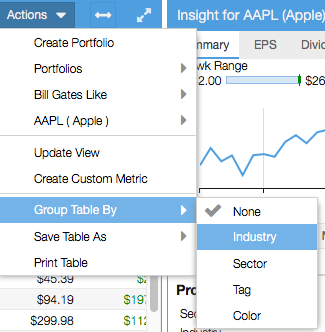
The sector allocation pie chart does not include the industry breakdown. For that, load your portfolio in the Table as shown earlier and go to Actions> Group Table By > Industry, shown here:

This will break the stocks in the Table into industry clusters, each with a summary line. Use the Value (%) column to see the allocation of each industry. In the example below, we see that stocks in the Travel Services industry together represent 0.2% of the portfolio’s total value.

For more information on using Stock Rover, see our Help pages or email our Support Team.