
Dividend investing punishes shallow data. A safe 4% yield and a value trap look identical in a one-year view; the difference lives in payout history, growth streaks, free-cash-flow cover and what your whole portfolio’s income will actually be next year. Here’s what to use.
$29–$79/mo billed annually · 14-day card-free trial. 30 years of per-ticker dividend history, growth streaks and CAGRs, payout vs FCF, sector percentile screening across 800+ metrics, then the part screeners skip: link your brokerages and the Portfolio Performance Report projects the next twelve months of income, payment by payment.
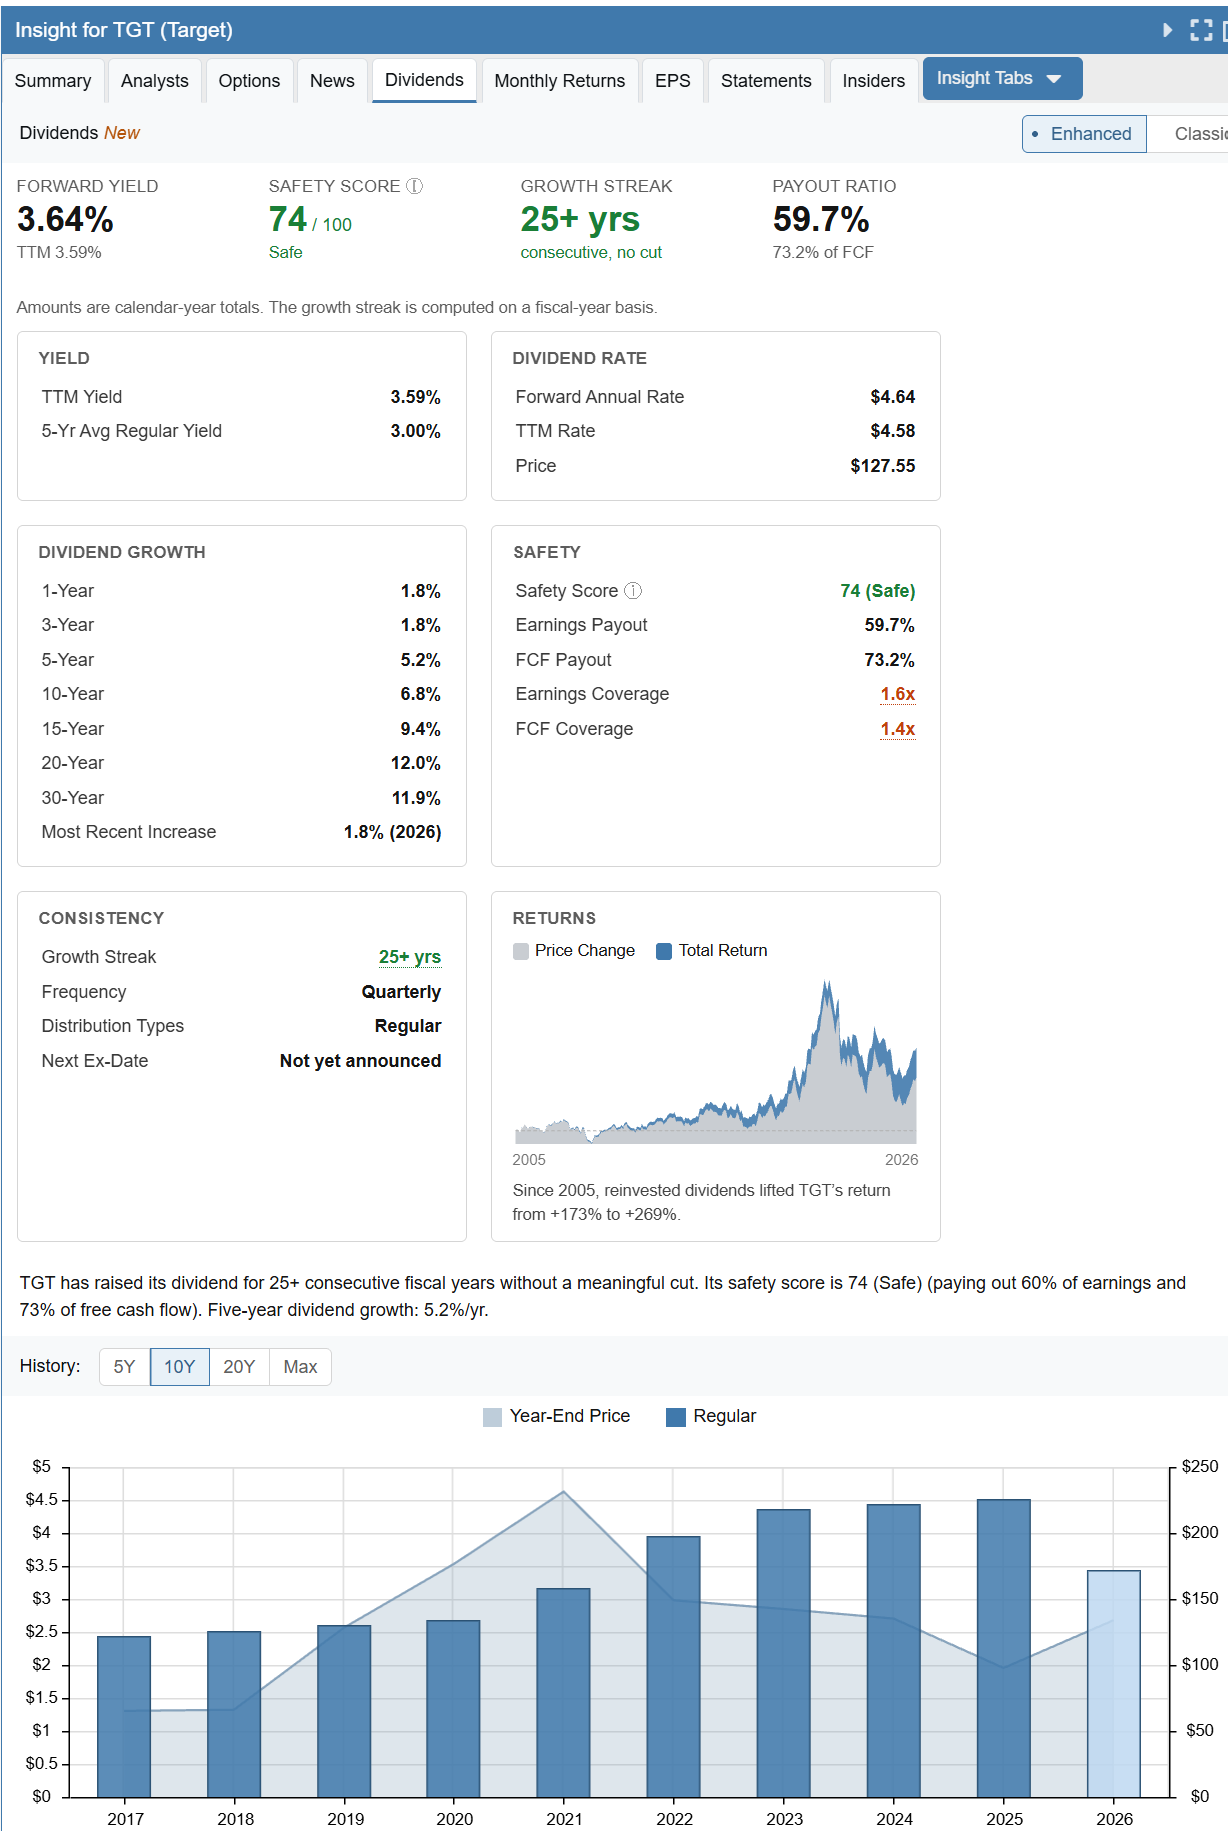
Studying one payer: safety, streak, coverage, and growth rates back 30 years, the same metrics the screener filters on.
~$499/yr. The specialist: hand-maintained dividend safety scores with an excellent track record on cut prediction, plus clean income planning tools.
Freemium; paid tiers. Beautiful income calendars and dividend-growth visualizations across linked accounts; tracking-first, screening-second.
$249/yr. If your income comes from funds (SCHD-style ETFs, CEFs), the ratings and analyst work are the reference point.
Free. Quick yield/payout screens to build a candidate list in five minutes.
In Stock Rover: yield > 2.5% · 10+ year growth streak · payout ratio < 60% of FCF · interest coverage > 5 · dividend 5-yr CAGR > 5%, then rank by sector percentile and check the 30-year chart for 2008/2020 behavior. That’s the whole discipline, and it’s repeatable.
Run the screen above and project your next twelve months of dividends, free for 14 days.
Disclosure: Stock Rover publishes this page. Competitor pricing verified August 2026. See also: all comparisons · the Portfolio Performance Report.