Chapter III has the following exercises:
- What is a company you are interested in studying? Why? Where did you hear about it?
- What do they do? How do they make money? Visit the company’s website and find its investor relations page.
- How is the company planning to grow its business? What are some of the risks the company faces? The opening sections of annual or quarterly filings can be a great place to find this information.
- Find the company’s earnings per share and sales (AKA revenue). Are these numbers getting better or worse over time?
- Find the company’s current price and price/earnings (P/E) multiple. How does the P/E compare to the prices and P/E’s of other companies in the same industry?
- What is your thesis about this stock so far? Do you think it could be a good investment?
- If you like it, add it to a watchlist for later research. Be sure to make a note of the factors you are going to keep an eye on.
Below you can find instructions for using Stock Rover to answer these questions.
Go to a Company’s Homepage and Investor Relations Page
From Stock Rover, you can link to a company’s homepage through the Summary tab of the Insight panel, as shown in the screenshot below:

Remember, to show a ticker in the Insight panel, select its row in the Table. Once you’re on the company homepage, just look for the Investors section or Investor Relations page. This is often in the top menu bar or in the footer navigation.
You can also find direct links to the Investor Relations pages for many companies in bivio’s Ticker Research links.
Find Annual and Quarterly SEC Filings
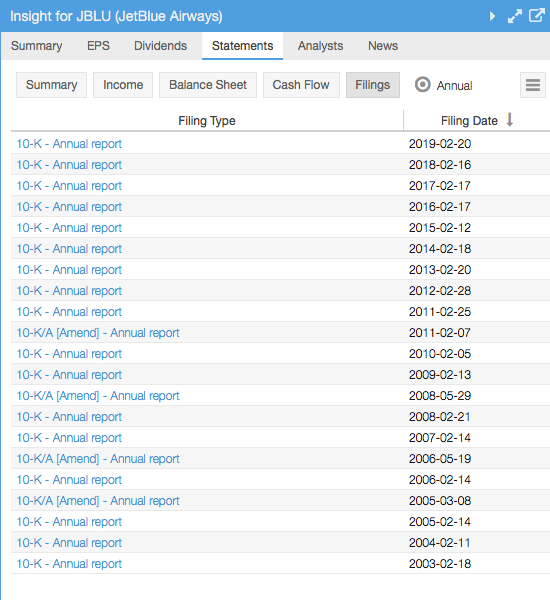
Find links to annual and quarterly SEC filings in the statements tab of the Insight panel, as seen below.
Find Earnings Per Share and Sales
There are multiple places where this information can be found in Stock Rover.
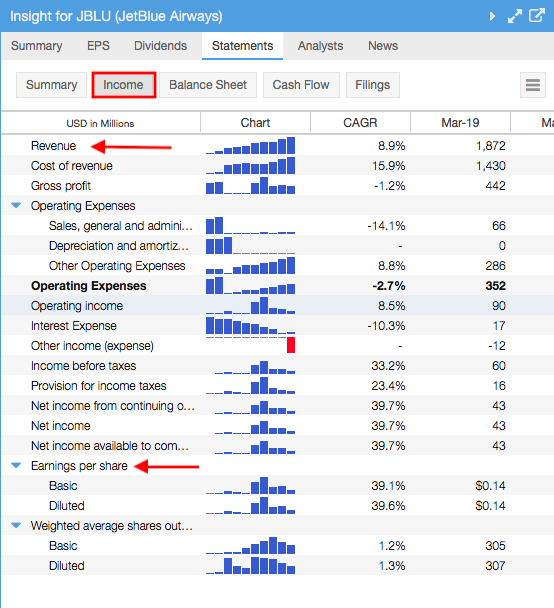
Insight panel, Statements tab: To see changes in EPS and sales over time, go to the Statements tab in the Insight panel, and open the income statement, then find the revenue and EPS lines. These are called out below:
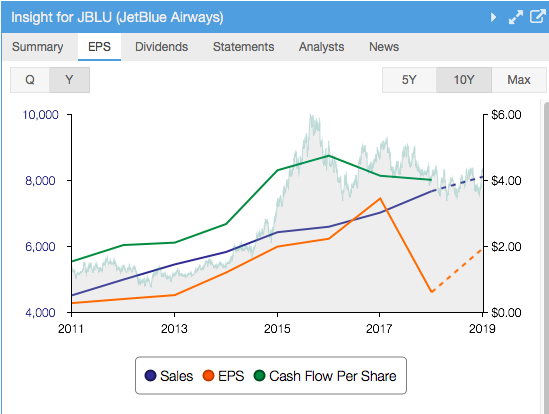
Insight panel, EPS tab: You can also open the EPS tab for a chart of Sales and EPS, like this:
Tooltip: Simply mouse over the ticker symbol to see its “tooltip” with helpful summary information on the stock. The EPS and Sales fields are called out below. This will only show you the current information, not historical data.
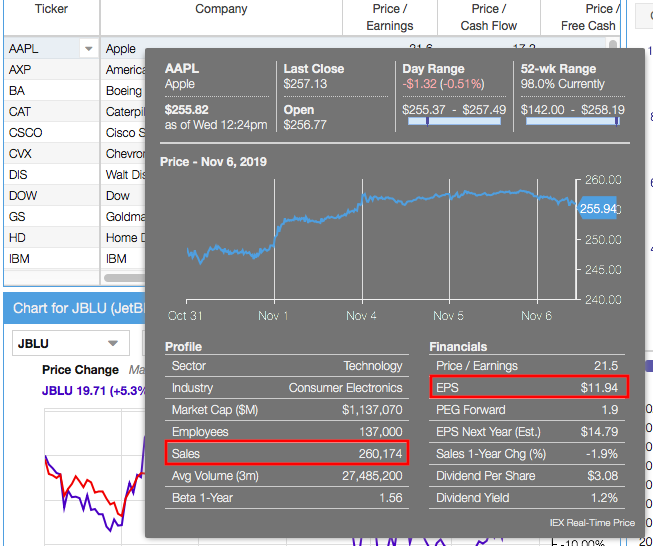
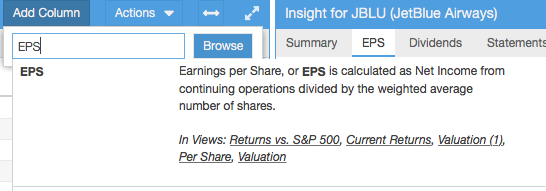
Table: Add the Earnings per Share (EPS) or Sales columns to any view using the ‘Add Column’ button. You can also open a view that already contains these metrics.
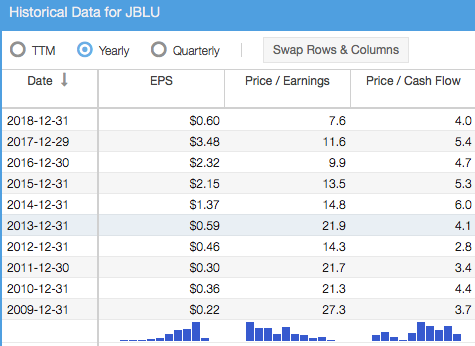
Once you have found the columns in the Table, you can then right-click on the ticker and select ‘Historical Data’ and it will display the window seen below:
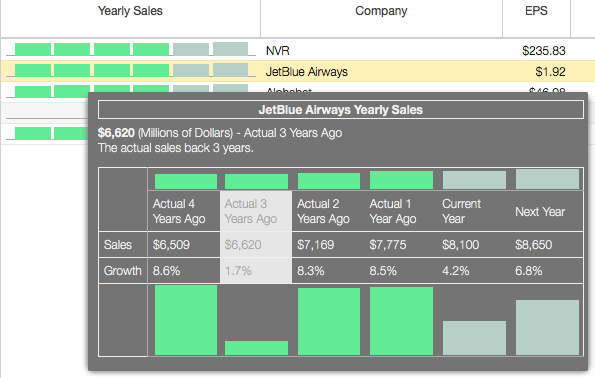
Alternatively, in the Table, you could find the columns for Yearly Sales, Quarterly Sales, Yearly EPS, or Quarterly EPS (these should be available in the “Growth” view). These are graphical columns with mouseover tooltips showing the change in these figures over the last 4 years. See below for an example.
Find Price and Price/Earnings
There are multiple places to find this information.
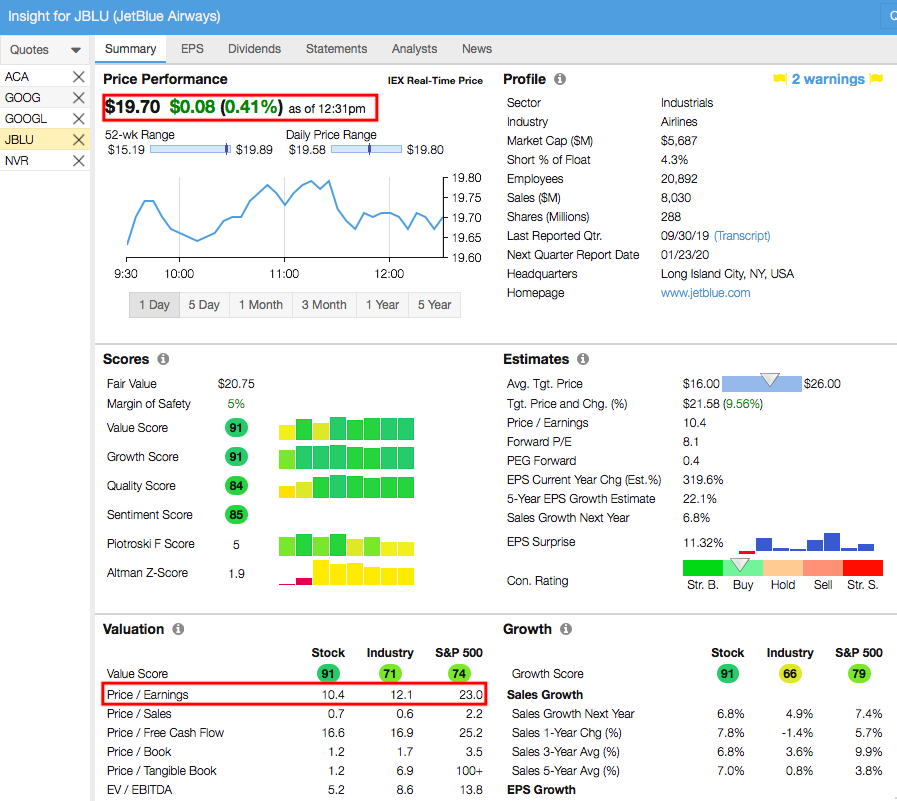
Insight panel, Summary tab: Both the price and P/E can be found in the Summary tab of the Insight panel, called out below. Notice also that you can see the average P/E for the stock’s industry and for the S&P 500
Table, Chart, or Tooltip: You can also find the price or P/E in the Table, Chart (from the Fundamentals menu), or in the ticker tooltip shown earlier.
Compare to Peers
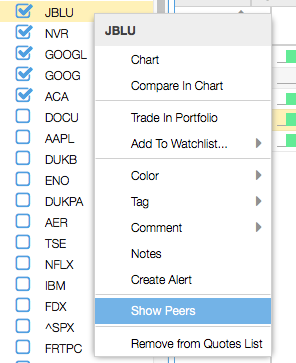
To compare a stock to its peers in the same industry, right-click on the ticker in the table and select ‘Show Peers’. It automatically brings in peers of the same industry. If not already shown, add Price/Earnings to the table using the ‘Add Column’ button.
Create or Add to a Watchlist
There are multiple ways to add a ticker to a new or existing watchlist. The fastest way is by right-clicking the ticker in the Table or Quotes List.
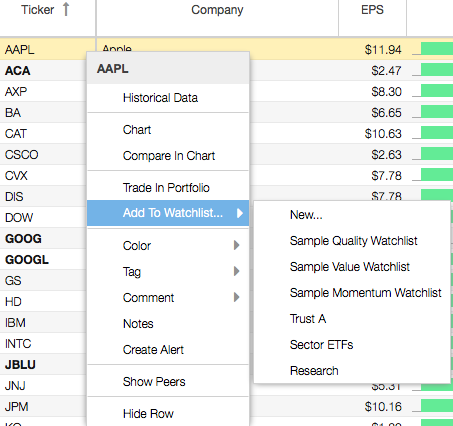
You can multi-select tickers in the Table and then use the right-click menu to add them all to the same watchlist. Note that right-click menus can also be found by hovering over the item and clicking the arrow that appears.
You can also find ‘Create Watchlist’ in the Start menu in the top left-hand side of your Stock Rover screen.
For more information on using Stock Rover, see our Help pages or email our Support Team.