Ready to dive into some of that quantitative data we mentioned in the last chapter? As an investor, you should develop a basic understanding of the most commonly used financial metrics and the financial statements on which they are based.
There are three main financial statements companies produce on a quarterly and annual basis. They are the balance sheet, the income statement, and the cash flow statement. All three can be used to help you understand a company’s financial profile—if it is healthy, growing, efficient, profitable, et cetera.
The first statement we’ll look at is the balance sheet. The balance sheet is a statement of the financial position of the company at a particular moment in time. It shows assets (how much a company owns or is owed) and liabilities (how much a company owes in debt or other obligations) at a specific point in time. It also shows the stockholders’ equity in the company, which is the assets minus the liabilities.
That is why it is called a balance sheet: the total assets must equal the total of the liabilities plus stockholders equity. As an investor, you want to find companies who can manage their assets and liabilities wisely and generate a good annual return on your stockholders’ equity.
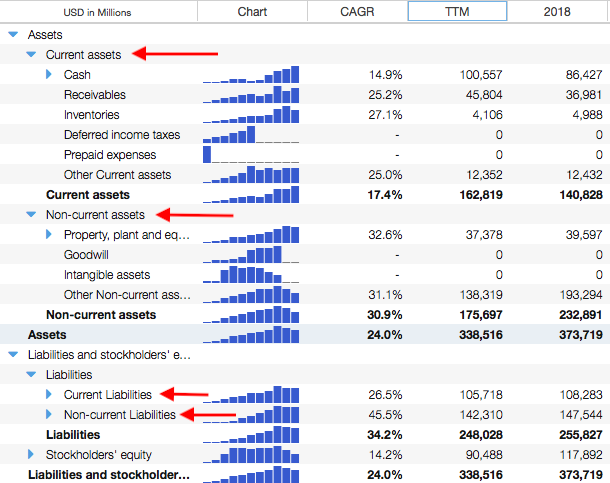
Assets and liabilities are detailed according to whether they are current or non-current. Current means liquid or due within the current accounting year. Examples of current assets are cash, short term investments such as bonds, and product inventory. Current liabilities include accounts payable and short-term loans. Non-current means illiquid or longer term. Examples of non-current assets are buildings and equipment, and examples of non-current liabilities are long-term leases and loans. The image below shows current and non-current items called out with red arrows.

Stockholders’ equity (AKA shareholders’ equity or book value) is total assets minus total liabilities. Stockholders’ equity represents the equity stake currently held on the books by a firm’s equity investors. For example, in the image above, the stockholders’ equity is $90,488M, which is $338,516M (total assets) minus $248,028M (total liabilities).
When exploring balance sheet information in Stock Rover, here are a few things to look at:
- Long term debt over time — A simple way to understand how much debt a company is taking on is to look at the line for Long Term Debt and see how it changes over time. Debt creates an expense for a company and can drag down profitability if mismanaged. Rapidly increasing debt is not necessarily a bad thing for a growing company, but it should raise the question of how that debt is being used and if the interest expense (found on the income statement) is easily covered by their income.
- Debt/equity —This is debt (long term plus short term) divided by stockholders’ equity, and it serves as a quick test of financial leverage. A low ratio is generally desirable, but there is no rule about what makes a “good” ratio; it depends on the business. A manageable amount of debt may be very valuable for a company that is able to use it wisely to generate a good return from their business. That is one of the things you’ll assess as you evaluate the company.
- Cash relative to liabilities — An increase in cash and cash equivalents, especially relative to short-term liabilities, means the company is becoming more liquid. That is usually good. Cash provides flexibility and opportunities for growth.
For a list and definitions of other metrics based on data in the balance sheet, go here.
In summary, the balance sheet is a good place to get a quick take on the company’s liquidity and financial position as you start to build an overall picture of the business. It’s especially useful to use it alongside the income statement and cash flow statement, which are covered in the next chapters.
Exercises:
Get to know the balance sheet with these tasks.
- Find the balance sheet of the company you’re interested in. Switch between quarterly and yearly balance sheets.
- Have total assets increased or decreased over time? What about liabilities?
- Find long term debt. Has it increased or decreased over time?
- Calculate debt/equity (total debt divided by stockholders’ equity). Then, find the debt/equity ratio in the Table. Does the number you calculated match the ratio in the Table after rounding? It should!
- Find the company’s Morningstar grade for Financial Health. Does this grade make sense to you based on what you have learned about the company’s financial health through these exercises?
- Do you see changes in any of the balance sheet metrics over time that lead you to questions about the company’s business and operations? What are your questions?
For instructions on finding all of this information in Stock Rover, see this appendix.
Next: Income Statement
This guide was created in partnership with bivio, which provides online investment club accounting and hedge fund management services.