Stock Rover has almost endless resources to help you research stock, ETF and fund investment opportunities thoroughly and completely, so you can be confident in the investment decisions you make. Below we have highlighted a few of the many data rich capabilities of Stock Rover.
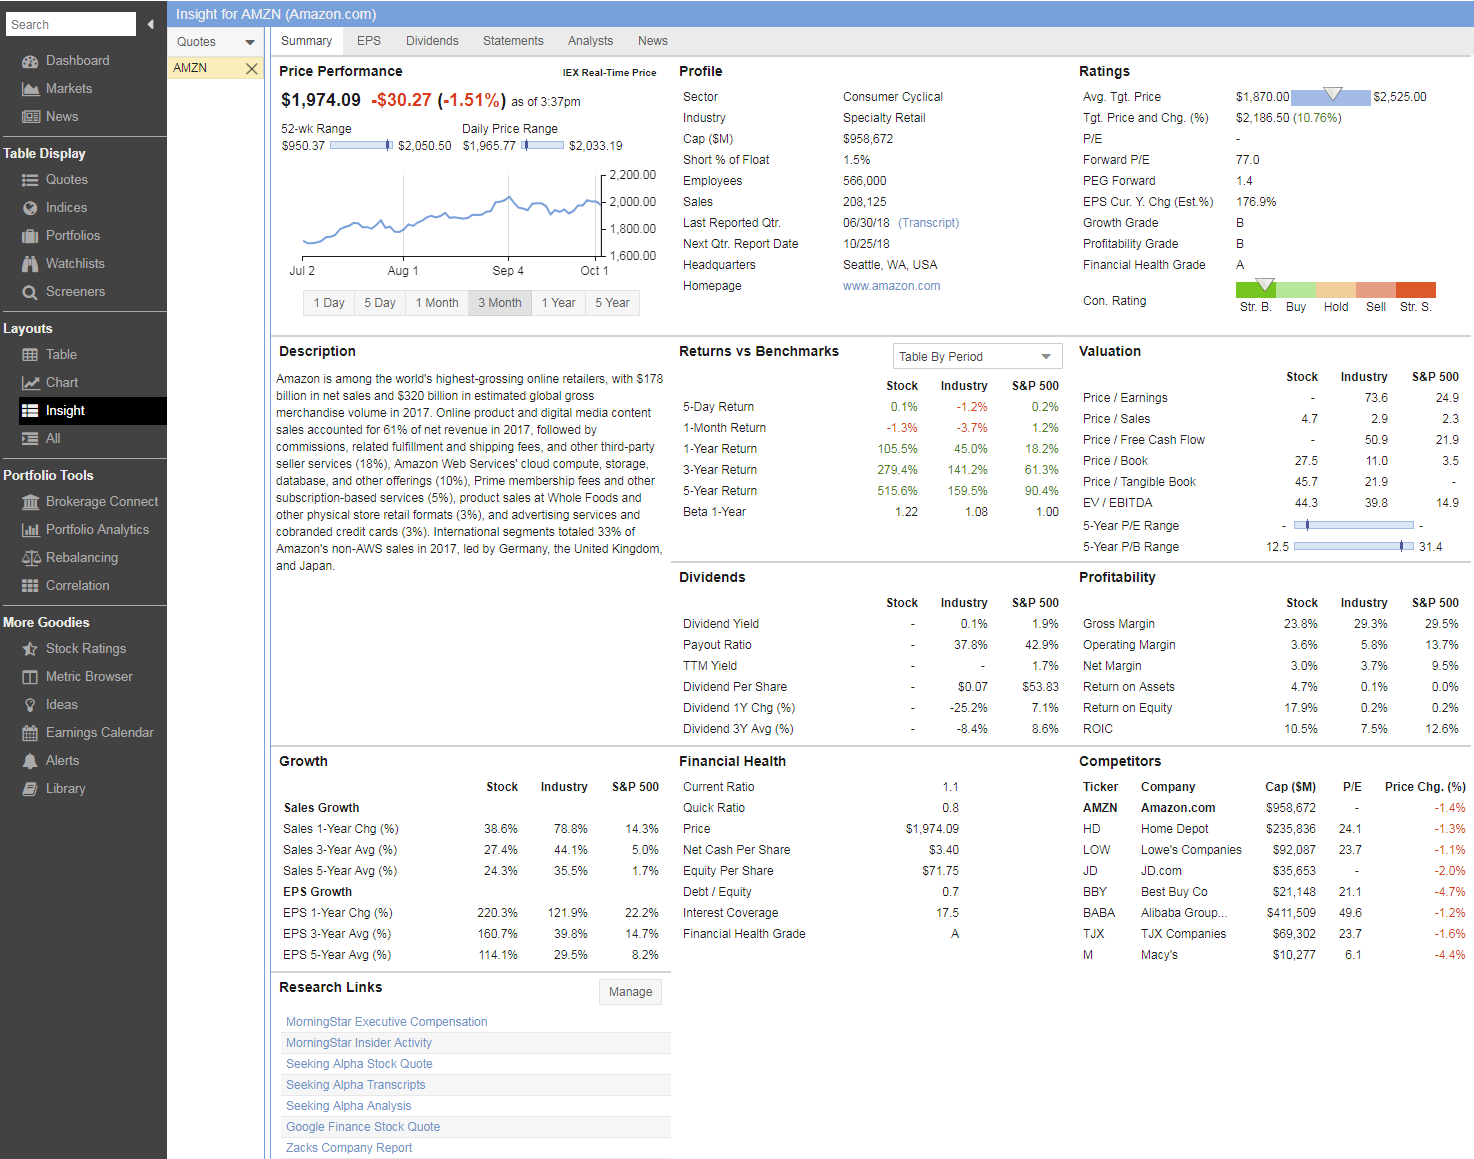
Comprehensive Metrics
Stock Rover provides over 550 financial, operational, pricing and performance metrics. Metrics cover areas such as growth, profitability, financial strength, capital efficiency, price performance, momentum, dividends, analyst ratings, stock ratings, industry and sector decides, and many more, including advanced metrics such as the Piotroski F-Score, Price to Graham Number, Shiller P/E, Margin of Safety, Beneish M-Score and the Altman-Z score. Most metrics come with a detailed 10 year history and most are chartable. Click here for a full list of our metrics.
Stock Rover comes with a built in Metrics Brower to make it dead easy to browse, find and add metrics of interest to your Stock Rover data views.
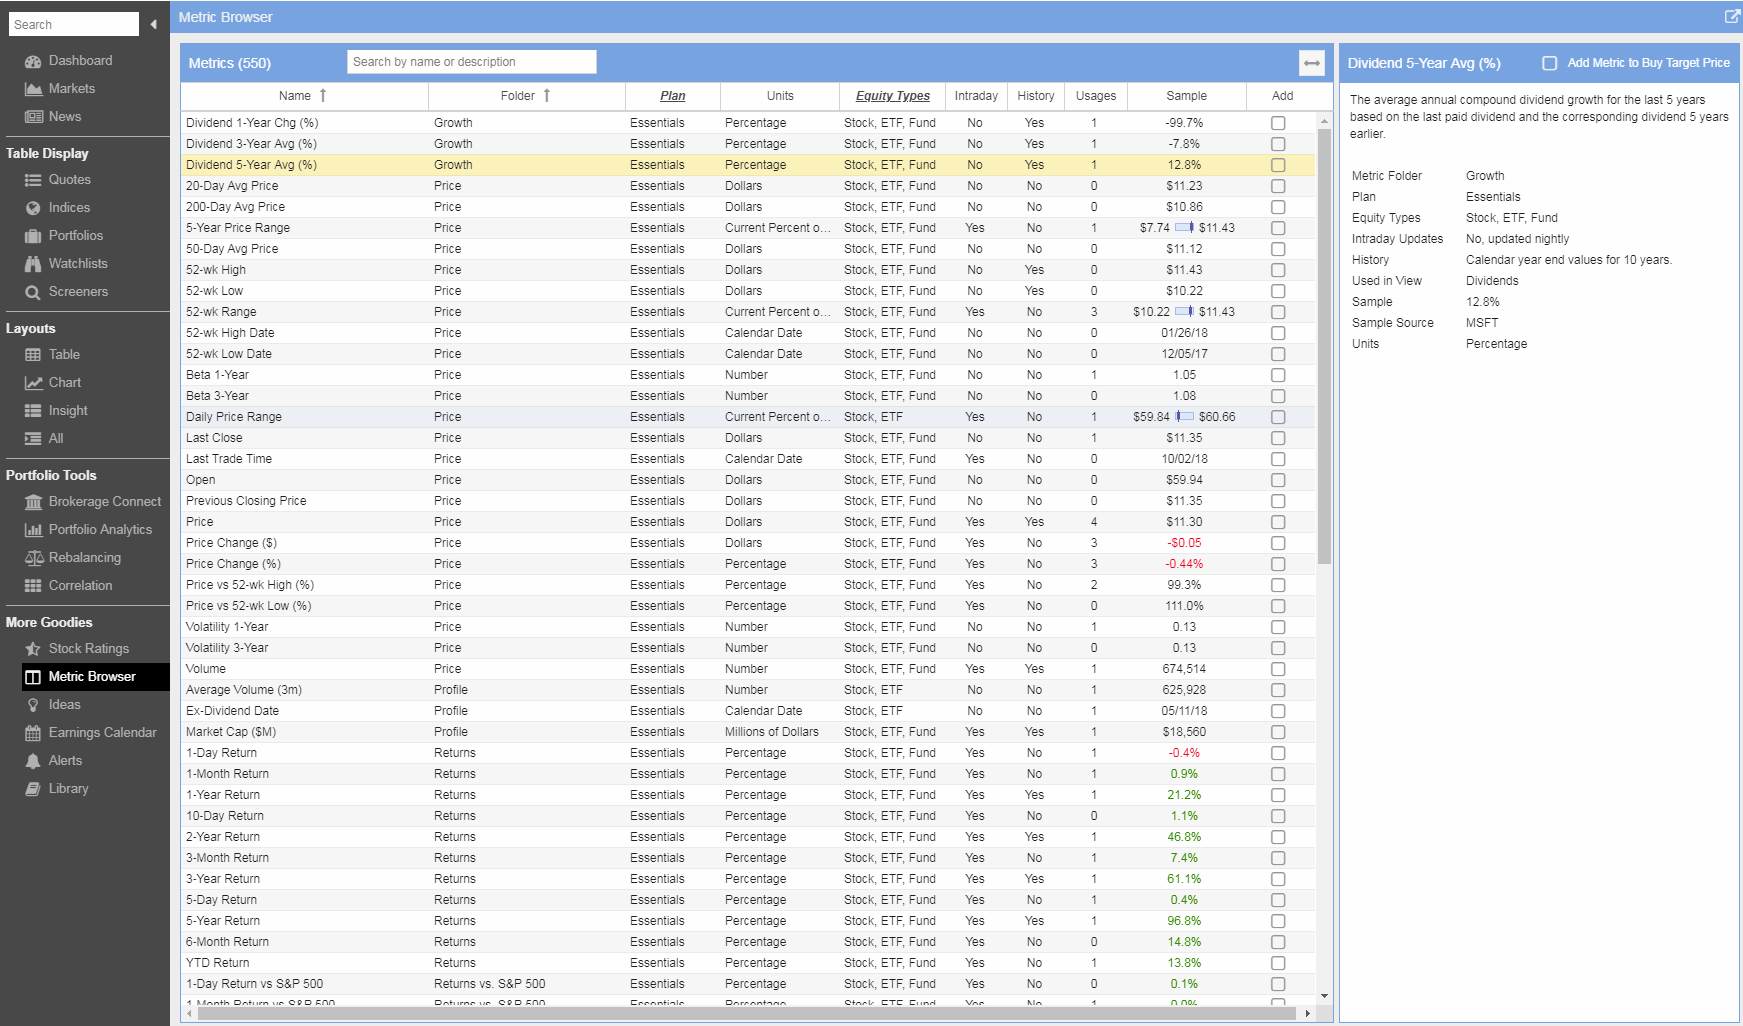
Stocks, ETF and Fund Insights
Stock Rover’s Insight Panel is home to detailed fundamental data, financial statements, sales, earnings, cash flow and dividend analysis, analyst ratings, company news, earnings transcripts and much more.

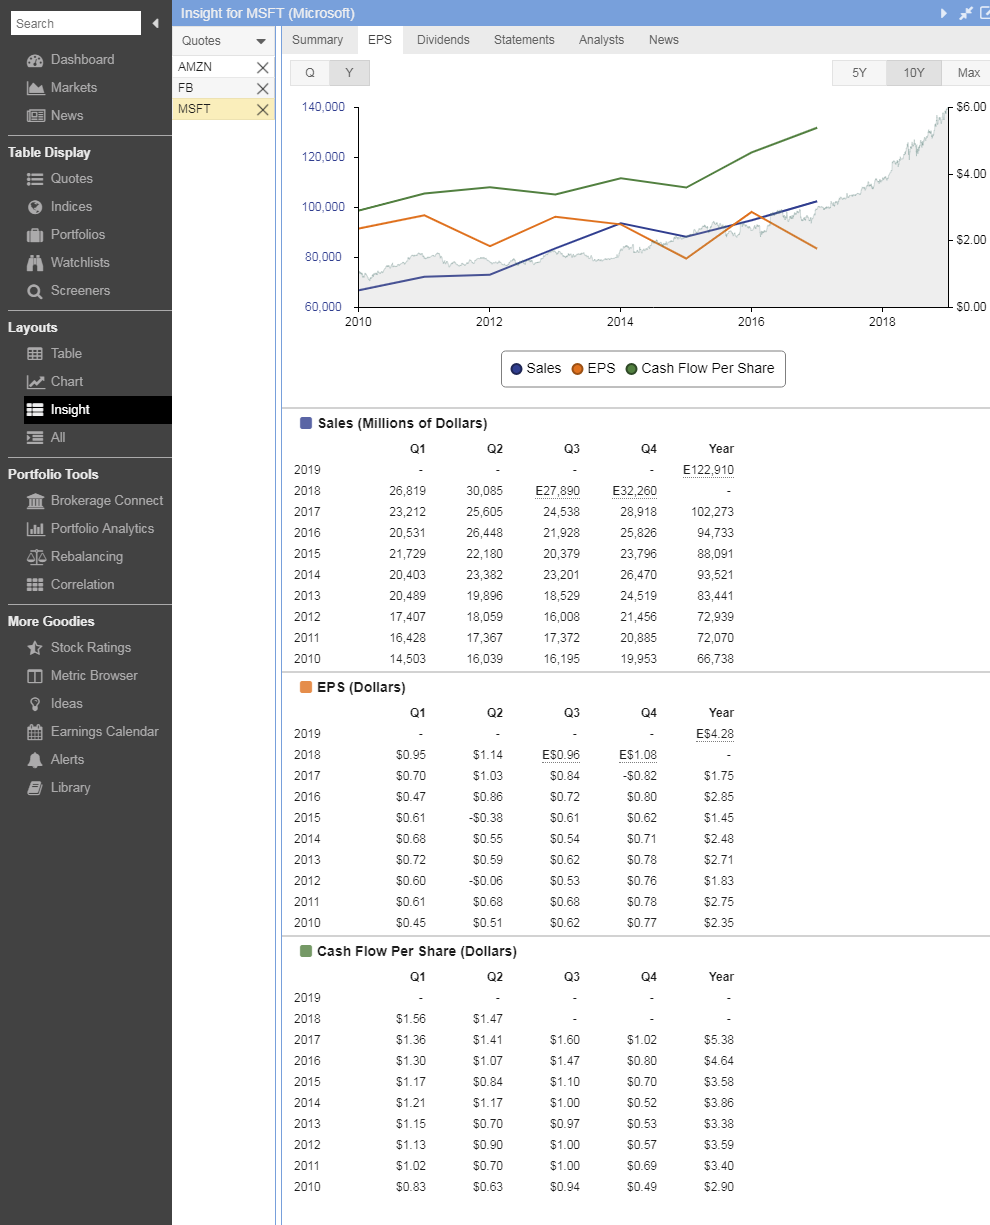
Here is an example of our Sales, Earnings Per Share and Cash Flow analysis panel.
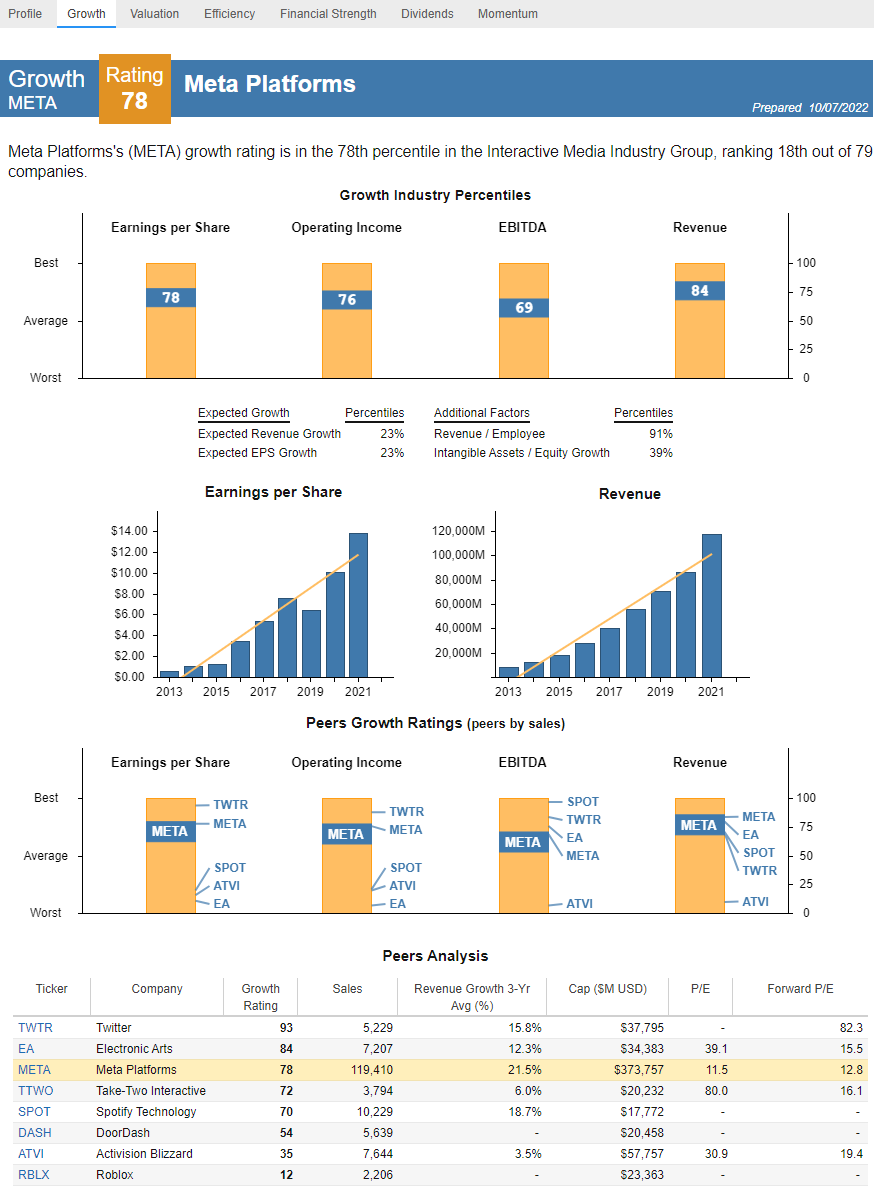
Stocks Ratings
Our unique Stock Ratings facility distill complex historical data into percentile performance grades for stocks vs. their peers in key areas such as growth, valuation, efficiency, financial strength, quality, dividends and momentum. An overall grade is rendered for each stock, making it easy to evaluate and compare different investment opportunities.
Comparative Financial Statements
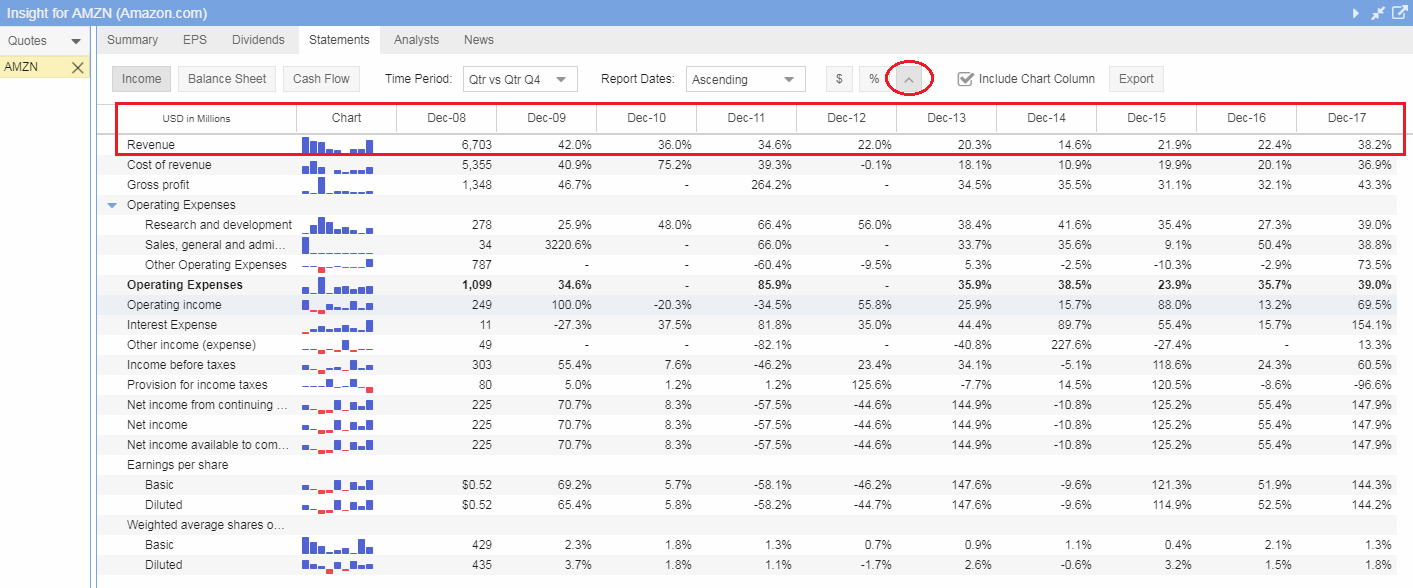
With Stock Rover You can compare a company’s quarter vs. quarter performance across 10 years of data. You can also see all statements on a percentage basis or on a percentage change from the prior period basis. These features makes it very easy to see a company’s performance over time on an apples vs. apples basis, especially when looking at companies with seasonal business like Amazon or Macy’s.
Dividend Insights
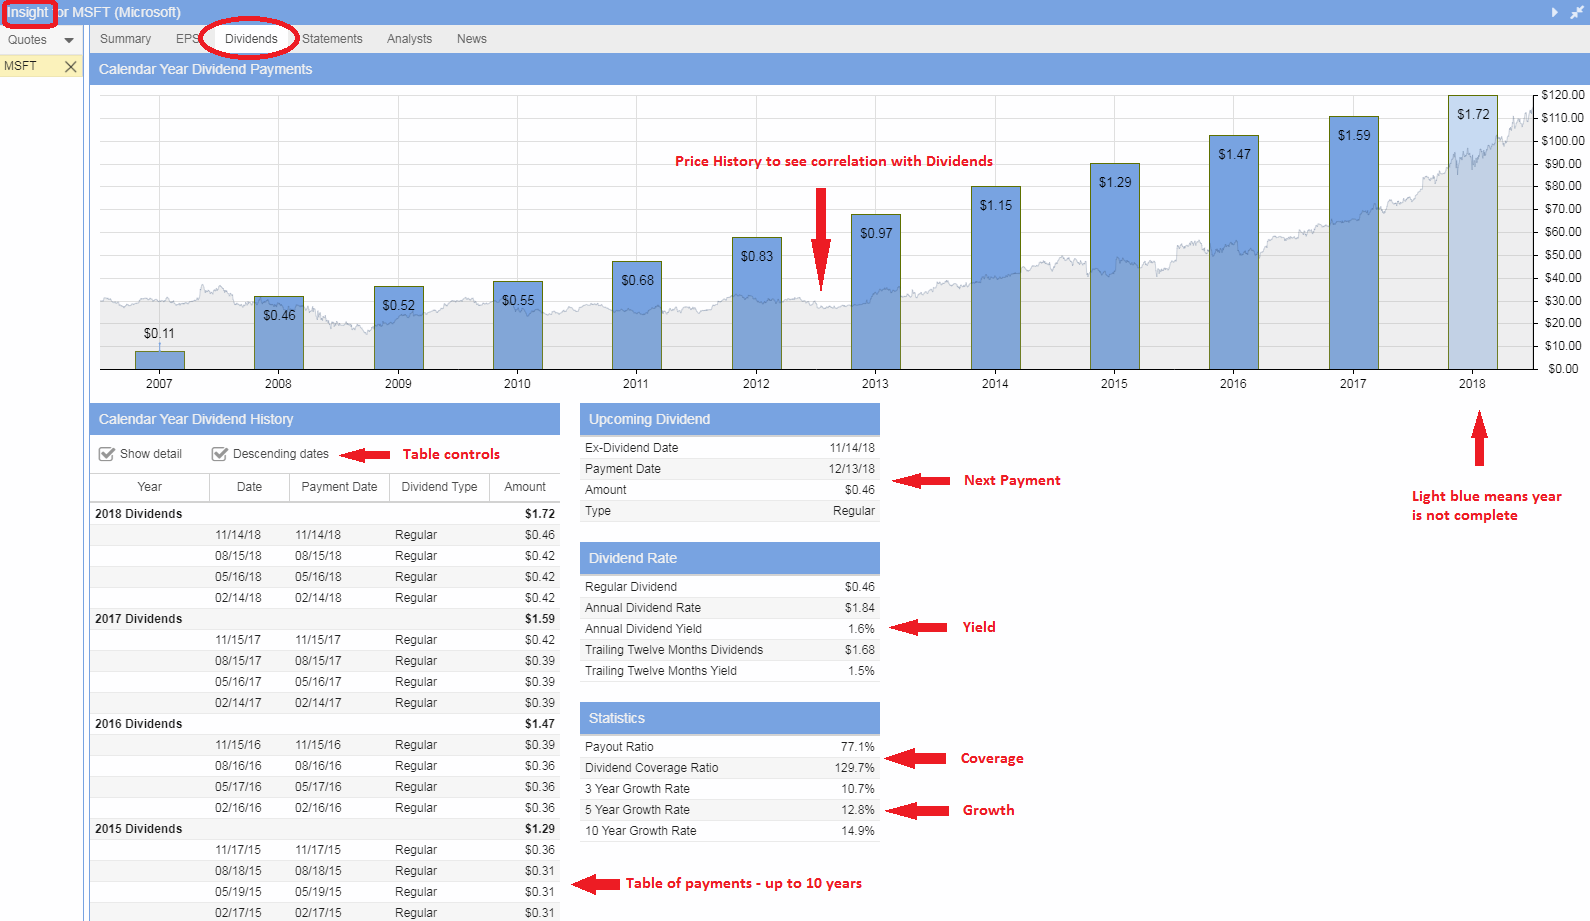
The dividend display in the Insight Panel is a great way to analyze the dividend performance of a stock, ETF or fund. The dividend display provides detailed metrics on yield, safety, coverage and growth of the dividend over time. You can also see all past and upcoming dividend payment information.
Analyst Ratings and Estimates
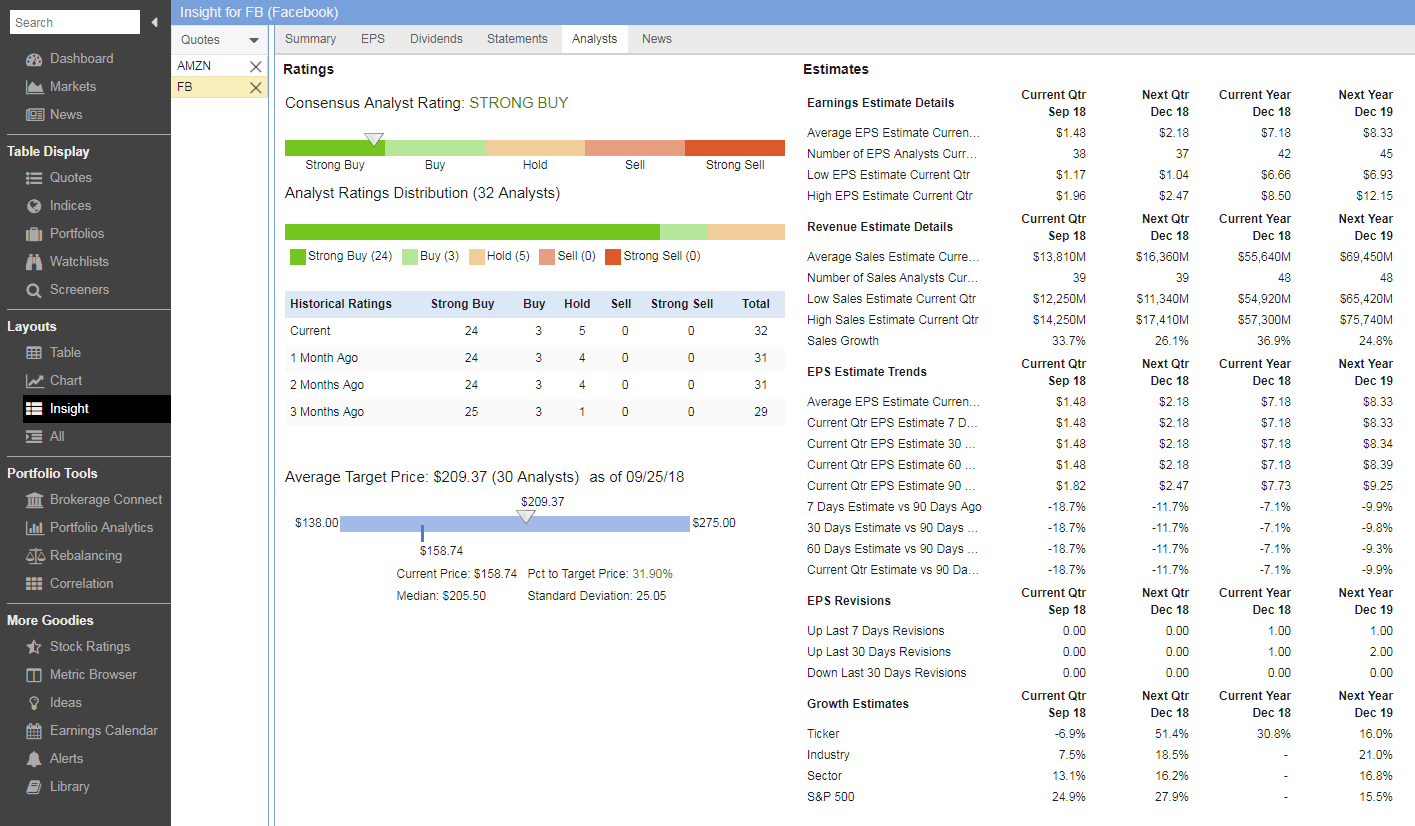
The analyst page provides a comprehensive view that analysts have towards a give stock including buy rating, price targets, earnings estimates and revisions and the level of dispersion of analyst estimates.
Latest News
Get comprehensive market and company news from a variety of user configurable news sources.
