Fantasy Portfolio: Choosing our Dividend Growers
 Printer Friendly
This is the fifth post in our Fantasy Portfolio Blog series, in which we build a fantasy portfolio from scratch and then track it over time (check out posts 1, 2, 3, and 4). Up until this point we’ve decided on a style of portfolio (Dividend Growers), discussed dividend safety, built a dividend growers screener and pared down the returned stocks. Now, we have a list of 26 promising stocks with strong growth in Sales, EPS, and dividends and solid price performance. In this post we’re going to whittle it down even further to a final set of stocks that will make it into our fantasy portfolio.
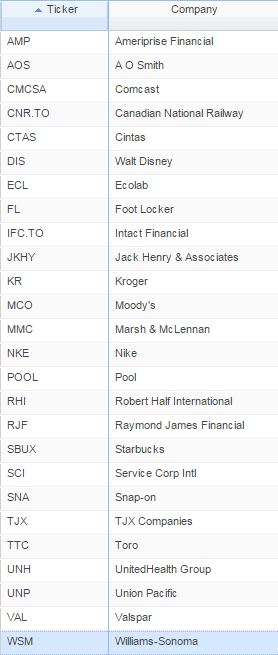
First, let’s take a look at the 26 stocks that have made it:
Now, let’s look at them grouped by sector:
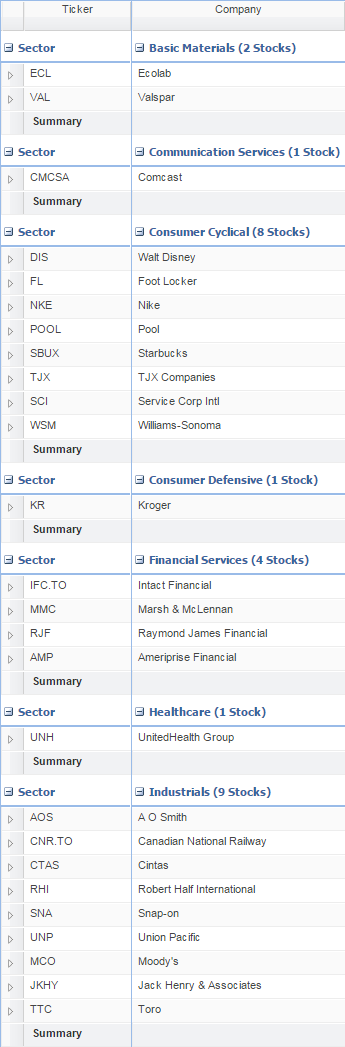
When we do this, we can see that we have:
- 2 in Basic Materials
- 1 in Communication Services
- 8 in Consumer Cyclica
- 1 in Consumer Defensive
- 4 in Financial Services
- 1 in Healthcare
- 9 in Industrials
Before going into the specific stocks, I’ll talk a little bit about each of these sectors, and see how they’ve been doing in the past few years.
Contents
- Basic Materials
- Communication Services
- Consumer Cyclical
- Consumer Defensive
- Financial Services
- Healthcare
- Industrials
- Basic Materials
- ECL (EcoLab)
- VAL (Valspar)
- Communication Services Stocks
- CMCSA (Comcast)
- Consumer Cyclical
- DIS (Disney)
- FL (Foot Locker)
- NKE (Nike)
- POOL (Pool)
- SBUX (Starbucks)
- SCI (Service Corp Intl)
- TJX (TJX Companies)
- WSM (Williams-Sonoma)
- Consumer Defensive
- KR (Kroger)
- Financial Services
- AMP (Ameriprise Financial)
- IFT.TO (Intact Financial)
- MMC (Marsh & McLennan)
- RJF (Raymond James Financial)
- Healthcare
- UNH (UnitedHealth Group)
- Industrials
- AOS (A. O. Smith)
- CNR.TO (Canadian National Railway)
- CTAS (Cintas)
- JKHY (Jack Henry & Associates)
- MCO (Moody’s)
- RHI (Robert Half International)
- SNA (Snap-On)
- TTC (Toro)
- UNP (Union Pacific)
- Picking the Final Set
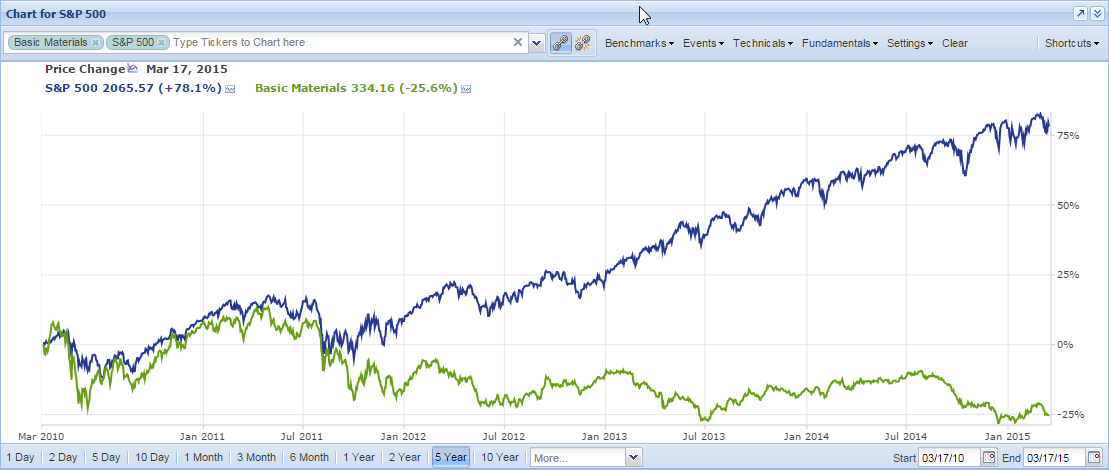
Basic Materials
This sector contains stocks for companies that process raw materials that are used in the manufacturing economy, such as metals and chemicals. As this sector susceptible to changes in supply and demand and is affected by changes in the business cycle, as well as interest rates and currency fluctuations. Additionally, the products in Basic Materials are commodities and thus are virtually indistinguishable from each other, making cost an extremely important factor.
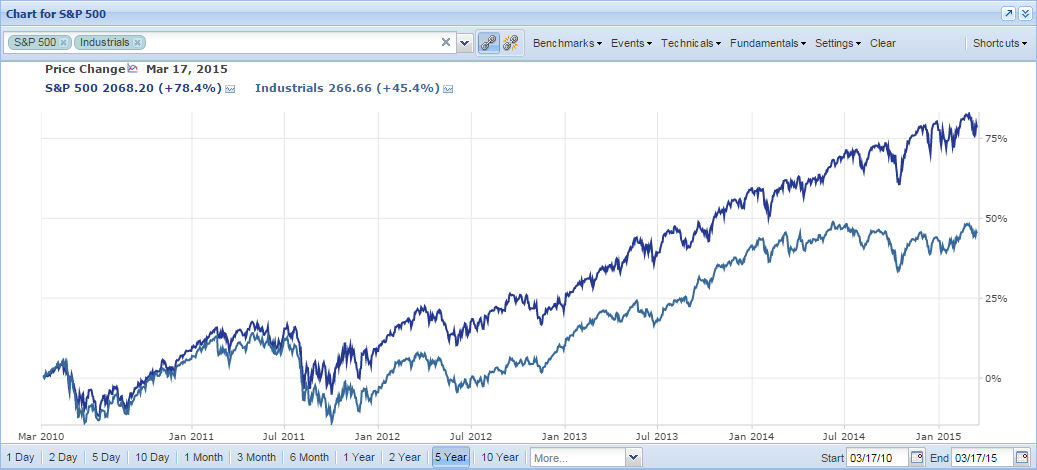
Basic Materials has done very poorly in the past five years, and is actually down around 25%, even while the S&P is up 78%.
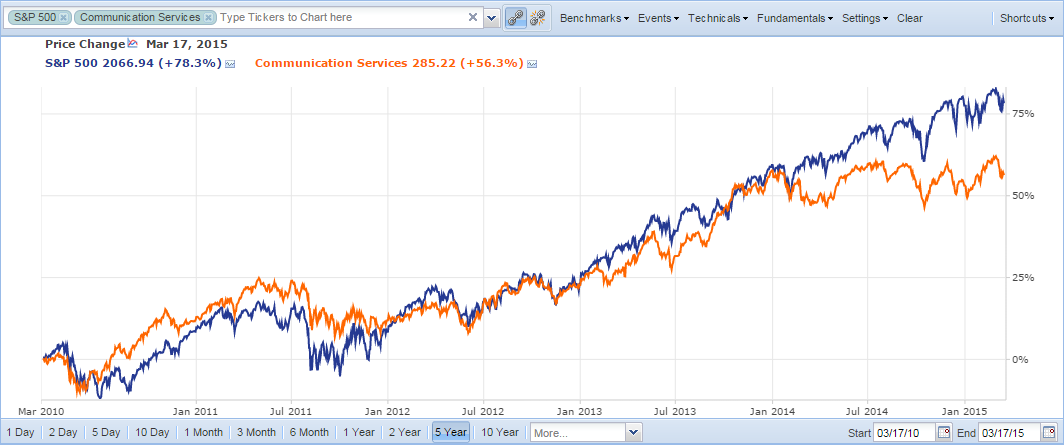
Communication Services
Communication Services contains cable and telecom companies and tend to be more defensive because of the recurring revenue streams. In the past five years, Communication Services has done well, and was tracking with the S&P 500 until the start of 2014, when it started to lag behind.
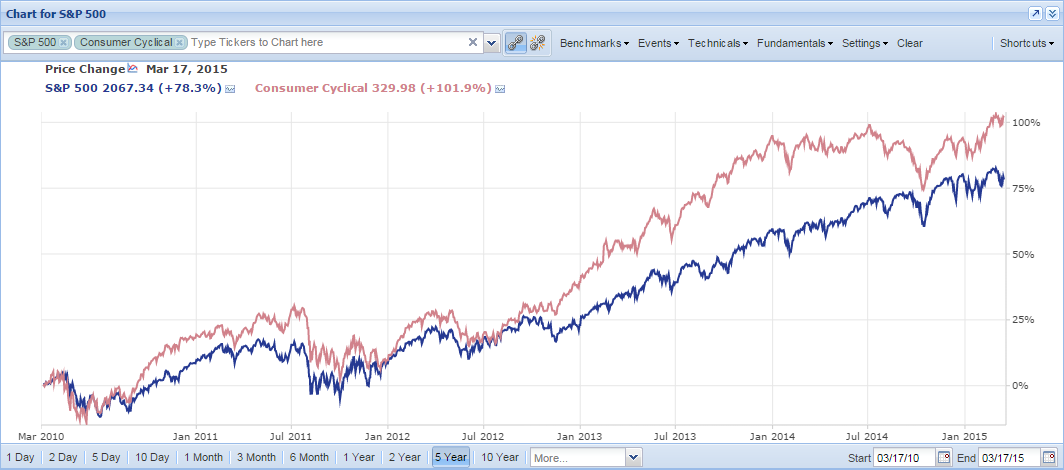
Consumer Cyclical
This sector contains stocks that rely heavily on the business cycle and economic conditions, such as automotive, housing, and retail stocks. In the past five years, this sector has outperformed the S&P 500, particularly in the last 2 years as the economy has gotten stronger.
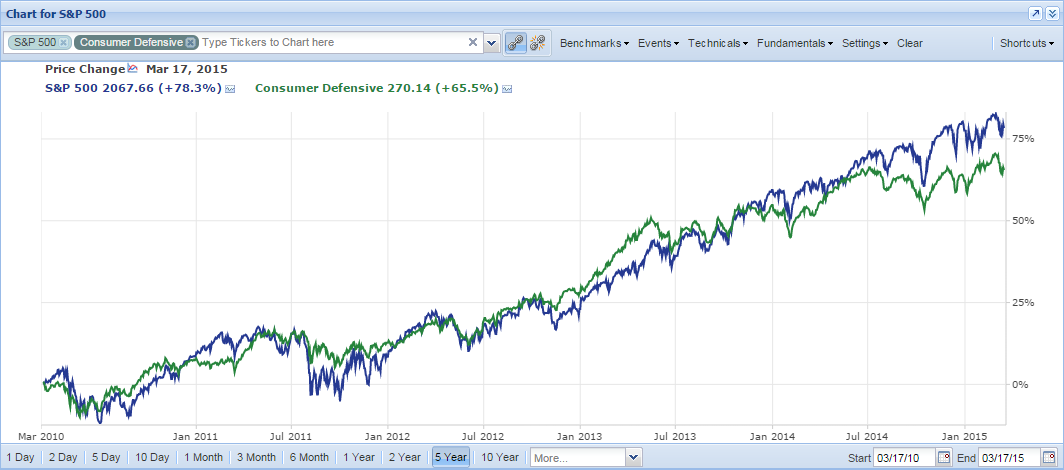
Consumer Defensive
Consumer Defensive, also called “Staples”, contains stocks of companies who sell goods that are purchased regardless of the state of the economy. Because of this, they tend to provide stable earnings in both good times and bad. While they usually outperform the market during recessions, they generally underperform the market in expansions. In the past five years, Consumer Defensive has underperformed the S&P by a little.
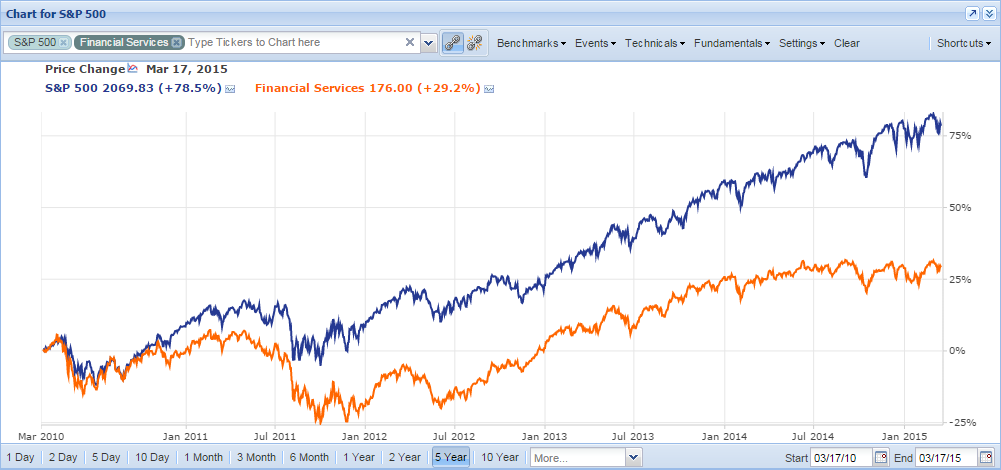
Financial Services
The Financial Services sector includes asset management firms, banks, and insurance companies, and its performance generally coincides with interest rate spreads and the perceived riskiness of assets, although this also depends on what specifically the firm does. In the past five years, Financial Services has underperformed the S&P by about 40%.
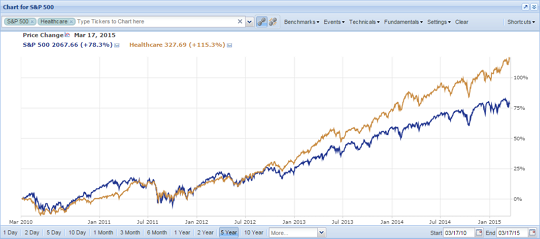
Healthcare
The Healthcare sector contains stocks in biotechnology, hospitals, health care plans, pharmaceuticals, and more. While Healthcare is often considered defensive, it does contain a large variety of companies. Some companies, such as health insurance companies, have stock prices that can be greatly affected new laws governing healthcare, where as other companies, like pharmaceuticals, can be affected by the success of new drugs, FDA approval, and patents. Because of these factors that don’t necessarily involve the business cycle, it’s important to monitor the news relevant to your healthcare stocks.
In the past five years, Healthcare has outperformed the S&P 500 by around 37%.
Industrials
Companies in industrials sell goods that are used in construction and manufacturing, such as industrial machinery, tools, and lumber production. Like Basic Materials, the performance of Industrials stocks is generally driven by the overall health of the economy. In the past five years, Industrials has underperformed the S&P by around 33%.
To briefly sum up, we have the candidates in the following sectors are considered somewhat defensive: Consumer Defensive, Healthcare, Communication services, whereas stocks in Basic Materials, Consumer Cyclical, Industrials, Financial Services are more cyclic.
Now, let’s step through these stocks one by one to see if we can narrow it down to around 8 really good candidates that we’ll add to our portfolio. For each stock, I’ll first look at the Insight panel and skim its description, then I’ll take note of its Morningstar grades and short percent of float, as well as take another look at its valuation, profitability growth stats against its industry. In the Detail tab I’ll look at the share count in the Income Summary section (to make sure share counts aren’t increasing), and in the Balance Sheet section I’ll look at the Debt/Equity and Days Inventory (to make sure they aren’t increasing). I’ll also revisit the analyst estimates and revisions. In the News tab, I’ll browse the headlines to see if anything particularly good or bad pops up. If anything at all seems troubling, I’ll color the stock red. If it all looks good, I’ll color it green. For brevity, I’ll mainly just comment on any troubling aspects of the stocks.
Basic Materials
ECL (EcoLab)
EcoLab is a Specialty Chemicals company that provides water, hygiene, and energy technologies. From Morningstar it got an A in Financial Health, a B in Growth, but a D in Profitability. It has a high P/E of 29.1, but slowing sales. Its shares are increasing over time, as is its Days Inventory. Furthermore, it has a downward revisions in its next year EPS estimates. Each of these factors individually wouldn’t be a deal breaker, but taken all together is enough to remove it from further consideration.
VAL (Valspar)
Valspar is in Specialty Chemicals and manufactures paints and coatings. It’s got good grades from Morningstar, lower-than-industry valuation of 18.1, and is decreasing its share count. The negatives are that its Debt/Equity and Days Inventory are increasing. But the analysts are revising upwards, and overall this looks like a strong and steady performer and I’ll cover it green.
Communication Services Stocks
CMCSA (Comcast)
I think most people know what Comcast is (the two main businesses are Comcast Cable and NBCUniversal, and it’s in the Pay TV industry.) It’s cheaper than its industry, but has had declining sales growth. Its Debt to Equity has gone up, but its share count has gone down (one consequence of the low interest rate environment is that some companies have taken on more debt to buy back shares, as this gives a better return in the long run.) It’s had several downward revisions to its next year EPS, though, so we’ll color it red, which knocks out the lone Communication Services stock from the running.
Consumer Cyclical
DIS (Disney)
Another household name here, in the Media – Diversified industry. Disney has five business segments: Media Networks (including ABC and ESPN), Parks and Resorts, Studio Entertainment, Consumer Products, and Interactive Media (the word “behemoth” is coming to mind.) It’s got a C in Growth and Profitability, but an A in Financial Health. It’s got a slightly higher P/E than its industry, at 23.7, but accelerating EPS growth. There are no readily visible red flags anywhere else, and combined with the positive next year estimate trend, I’ll color it green.
FL (Foot Locker)
Foot Locker is a retailer of athletic shoes and apparel in the Footwear & Accessories industry. Here the red flags are a slightly high short % of float (at 6.9%), a Growth grade of C, lower margins than its industry, and Sales growth that, while consistent, is still below its industry, and decreasing EPS growth. Once again, a few negative factors together make this an unattractive buy, and I’ll color it red.
NKE (Nike)
Nike is a competitor of Foot Locker, also in the Footwear & Accessories industry. It’s got the better Growth grade of B, but its P/E is quite high, at 30.2. Its sales, Operating Income, and EPS growth have been exceptionally steady over the past 5 years, but its next year’s EPS estimate have been revised downward by -4.3%. This, combined with its expensive valuation, gives me pause and I’ll color it red.
POOL (Pool)
Pool is a Leisure company and distributes—you guessed it—pool supplies and equipment. It’s got strong grades and growth numbers, though an expensive P/E of 28.7 (though under the industry average of 30.9). Everything but the PE looks good here, so I’ll color it green.
SBUX (Starbucks)
Starbucks (in the Restaurants industry) also comes out looking good, with the only obvious negative being its high P/E (29.2, though still below the industry average of 30.3). I’ll color it green.
SCI (Service Corp Intl)
Service Corp, in Personal Services, provides deathcare products and services. Over the past five years its Debt/Equity has gone from a reasonable 1.25 to a somewhat troubling 2.25, and its PE is at 33.7. I don’t want to pay so much (even with fake Stock Rover money) for a company with such high debt, so I’ll color this stock red.
TJX (TJX Companies)
TJX, in Apparel Stores, is an off-price apparel and home fashions retailer, probably better known by its store names T.J. Maxx and Marshalls. While it has strong grades from Morningstar, it has slowing growth in sales, Operating Income, and EPS, and its Days Inventory is creeping up, so I’ll color it red.
WSM (Williams-Sonoma)
Williams-Sonoma is a retailer for products for the home, and includes the eponymous store Williams-Sonoma, as well as Pottery Barn and West Elm. It’s got a high Payout Ratio of 41.5%, as well as slowing sales growth, lengthening Day Inventory, and recent downward revisions for next year’s EPS. I’ll color it red, which brings us to the end of our Consumer Cyclical stocks.
Consumer Defensive
KR (Kroger)
Kroger is in the Grocery Stores sector, and operates not just grocery stores, but drug stores, department stores, jewelry stores, and convenience stores. It has seen accelerated sales growth, but decelerated EPS and Operating Income. The most troubling thing about it is the Debt/Equity above 2, although looking back ten years we can see that this elevated state is pretty much to the norm for this company. It’s next year EPS has been revised upwards. Its P/E is slightly above its industry, and it doesn’t look a typical consumer defensive stock, and its price has gone up like a shot since the beginning of January 2014. I’m interested enough to keep it green, and that takes us through Consumer Defensive, with one lone stock.
Financial Services
AMP (Ameriprise Financial)
Ameriprise Financial offers financial planning services, in the Asset Management industry. Its Growth is rated B, though its Profitability and Financial Health are both C’s. Its growth in Sales, Operating Income, and Growth are fairly steady over the past five years, but its Debt/Equity is marching steadily upwards. Because the debt shows no sign of abating, I’ll color it red.
IFT.TO (Intact Financial)
Intact Financial is a Canadian company that provides property and casualty insurance. Its growth and profitability grades are both C’s, and though its sales are slowing, its EPS and Operating Income are growing, and it’s got upward revisions on its next year EPS. There are no other red flags, so I’ll color it green.
MMC (Marsh & McLennan)
Marsh and McLennan is in the Insurance Brokers industry, and is the parent company for other risk and specialty consultants. It’s got growth and profitability grades of C, and decelerating EPS growth over the past five years, and a slight negative downward revision for next year EPS estimates in the past month. I’ll color it red.
RJF (Raymond James Financial)
Raymond James Financial is a financial services and bank holding company in the Capital Markets industry. It sales growth has slowed in the past year, as has its Operating Income, though EPS growth has remained fairly steady. Its P/E is at a more attractive 16.9, versus its industry’s 18.2, but its share counts are slowly increasing over time. I’ll color this one red, and we can move on to the Healthcare sector.
Healthcare
UNH (UnitedHealth Group)
UNH is a healthcare company. It has a growth grade of B, but a Profitability grade of C. Though its EPS growth grade has slowed in the past year, it does have positive EPS revisions for next year. There’s nothing troubling in any of the other indicators, so I’ll color it green.
Industrials
AOS (A. O. Smith)
A. O. Smith is a company that manufactures and sells water heaters and boilers. It’s got a profitability grade of D, but Growth and Financial health grades of B. Its P/E is quite high, at 28.8 (compared to its industry’s 19.7), but it has a very strong EPS growth and upward EPS revisions. Nothing else is troubling, so I’ll color this one green.
CNR.TO (Canadian National Railway)
Canadian National Railway is in the rail and transportation business. They have a growth grade of B and a profitability grade of C. They have strong and accelerating growth in Sales and EPS, but with a slightly elevated P/E to match (at 23.8, compared to its industry’s 19.9). Their EPS estimates have been revised slightly upward, and everything else looks good, so I’ll color this one green.
CTAS (Cintas)
Cintas is in the Business Services industry, and provides a whole host of different services, including uniform rental, uniform direct sales, and safety and fire protection services. There is slightly higher short interest on this, with short % of float at 6.5%. They have a growth grade of B, but slowing sales growth and Operating Income, though accelerating growth in EPS. Even so, with the slowing in growth, I’ll color this one red.
JKHY (Jack Henry & Associates)
Jack Henry & Associates, also in Business services, provides core information processing solutions for community banks. It has Growth grades and Profitability grades of C. Its growth across sales, eps, and Operating Income has slowed over the past five years, though its EPS has been revised upwards for next year. I had flagged this stock earlier as having an increasing payout ratio, and it has indeed been creeping up over time. The increase in the payout ratio, combined with the slowing EPS, makes me uneasy, so I’ll color this one red.
MCO (Moody’s)
Moody’s provides credit ratings, as well as credit and economic related research. They’ve have consistent growth across sales, Operating Income, and EPS, over the past five years, and they are cheaper with regards to P/E than their industry. They had a slight downward revision to EPS, but that has been revised to be less negative over the past 30 days. Overall nothing looks too troubling, so I’ll color it green.
RHI (Robert Half International)
Robert Half International is in the Staffing & Outsourcing industry, and provides specialized staffing in accounting and finance. It has a Growth and Profitability grade of B, strong growth across sales, Operating Income, and EPS. It’s expensive at a P/E of 27, though cheaper than its industry’s 31.9. It has positive upward EPS revisions, and everything else looks good, so I’ll color it green.
SNA (Snap-On)
Snap-On is in the Tools & Accessories industry, and manufactures tools, equipment, diagnostics, repair information, and systems solutions. It has a growth grade and profitability grade of C, though fairly consistent sales, Operating Income and EPS growth. Its Days Inventory is lengthening by a few days over the past few years. It has upward revisions to its EPS, and a lower P/E than its industry (20.5 versus 25). Overall, it looks pretty good and I’ll color it green.
TTC (Toro)
Toro, in the Tools & Accessories industry, designs, manufactures, and markets professional turf maintenance equipment and services. It has a Growth grade of C but a profitability grade of A. It’s had solid and consistent sales, Operating Income, and EPS growth, and it’s cheaper than its industry with a P/E of 22.4. With upward revisions to its EPS for next year, and no other warning signs, I’ll color this stock green.
UNP (Union Pacific)
Union Pacific is a long-time Stock Rover darling [link], but we’ll try to take the same objective view on it. It’s a rail transporting company in the western part of the US. It has a Growth grade of B, but a profitability grade of C. It has a reasonable P/E of 19.2. Its Sales growth has come down a hair in the past five years, but its EPS and Operating Income growth rates have stayed strong. Everything else looks good, and there are positive EPS revisions, so we’ll color it green.
Picking the Final Set
At this point, we’ve got 14 stocks which I’ve saved as a watchlist, shown below, along with their P/E, beta, dividend yield, and dividend 1-year change, and grouped by sector.
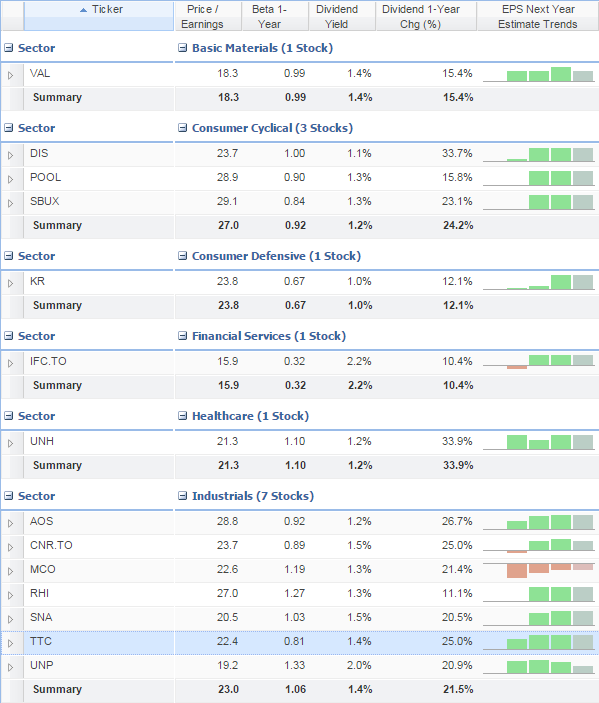
I’d like to choose a variety of sectors, so here it goes!
I’ll like Valspar because I like its lower P/E, and the diversification it’ll bring from its sector.
From Consumer Cyclical, I’ll put my money on Disney and Starbucks, which have the strongest dividend growth. SBUX also has the lowest beta in the group.
I’ll take Kroger as our only consumer defensive, even though I don’t quite like the debt, the rest of the numbers look good and its price performance has been very strong.
I’ll also go with the lone Healthcare stock of UNH because of its strong dividend growth.
In Industrials, I’ll take UNP, as it has strong growth, strong dividend growth, and the lowest P/E of the group. From there I’ll discount CNQ.TO, because I only want one railroad company. I’ll take Moody’s as well, and because both of those have betas above one, I’ll take TTC.
Now, as a final step, we’re going to look at the Correlation matrix to make sure these eight picks aren’t too highly correlated. So, here is the 1-year correlation matrix for these stocks (with a row and column included for the watchlist as a whole.)
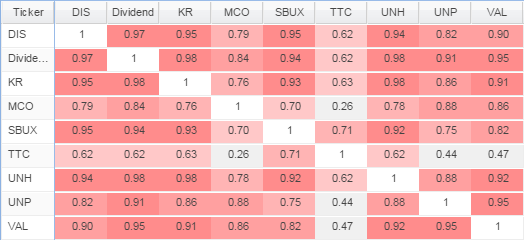
You can see that on the whole they are red, which means they are correlated, but there is a mix among the stocks, and I like that I’m seeing some grey and light pink shades, telling me that these are less correlated.
The last step is to actually create the portfolio! We’re starting with $100,000 of fake Stock Rover money, which would be $12,500 per stock. Luckily, in Stock Rover there is a very easy way to create an equal allocation portfolio—simply highlight all of the stocks, right-click and select “Trade in Portfolio” and you can choose to create a new portfolio, and specify the amount of per ticker. I’ve called this “Fantasy Dividend Growers” and you can download it from the Stock Rover library if you want to keep tabs on how it’s doing.
From here, we’ll check in roughly quarterly to see how this portfolio is doing, and make any changes that we might need.
Top