Introduction
When we launched Stock Rover V12 [9], we promised a platform built for continuous evolution and deeper market visibility. Today, we are excited to announce our first major feature expansion since the initial V12 rollout.
The latest update to Stock Rover V12 brings a big leap forward in how you analyze ETFs, mutual funds, and dividend-paying stocks. We are excited to make introductory versions of these features available to everyone while offering the full, unrestricted power of these new tools to our Stock Rover Ultimate subscribers.
Comprehensive Fund Reports
We are thrilled to introduce fully automated, deep-dive Fund Reports for the nearly 8,000 ETFs and 20,000 Mutual Funds supported in Stock Rover.
These detailed reports go far beyond basic performance charts to provide a comprehensive breakdown of a fund’s DNA. Alongside proprietary Risk & Income Scores and Morningstar Ratings, the reports allow you to look under the hood to assess top holdings, sector weights, and asset allocation. You can evaluate a fund’s true cost through tax efficiency and tracking error metrics, review up to two decades of distribution history, and even see a quick structural comparison against 14 similar peers.
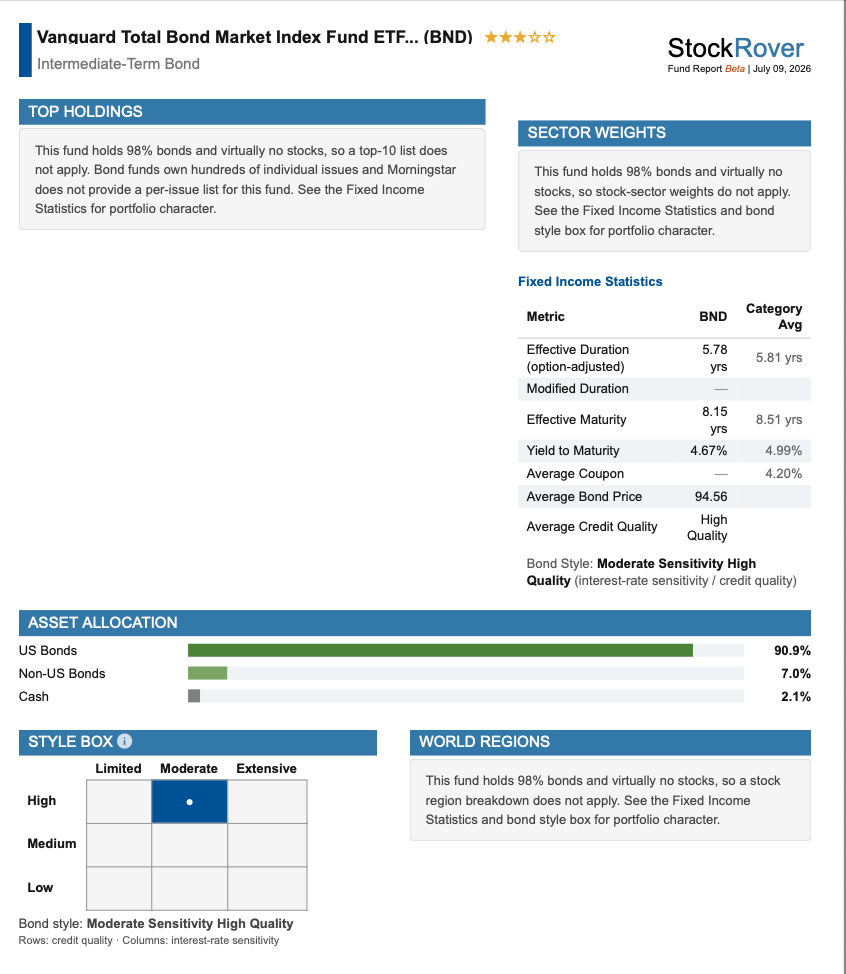
Click the image above to view a full, 7 page sample Fund Report for BND (PDF).
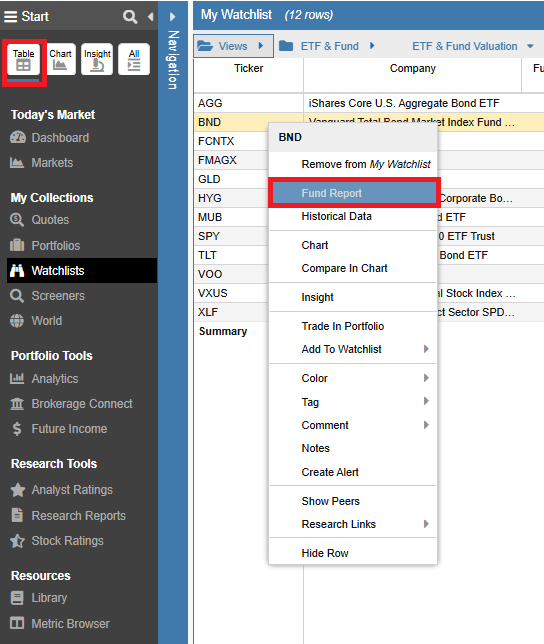
Right-click any ETF or Mutual Fund in the Table [10] and select “Fund Report”.
Subscribers to the Ultimate and Ultimate Pro plans have unrestricted access to generate these reports for the entire database of supported funds.
Enhanced Dividend Intelligence
For income focused investors, the Dividends Tab in the Insight Panel has received a major visual and analytical upgrade. By switching from the “Classic” to the new “Enhanced” view, you unlock a highly visual representation of a company’s payout consistency.
The Enhanced display charts up to 30 years of dividend payment history, alongside a Yield Over Time line chart, allowing you to instantly assess long term dividend growth, payout reliability, and yield fluctuations across decades of market cycles.
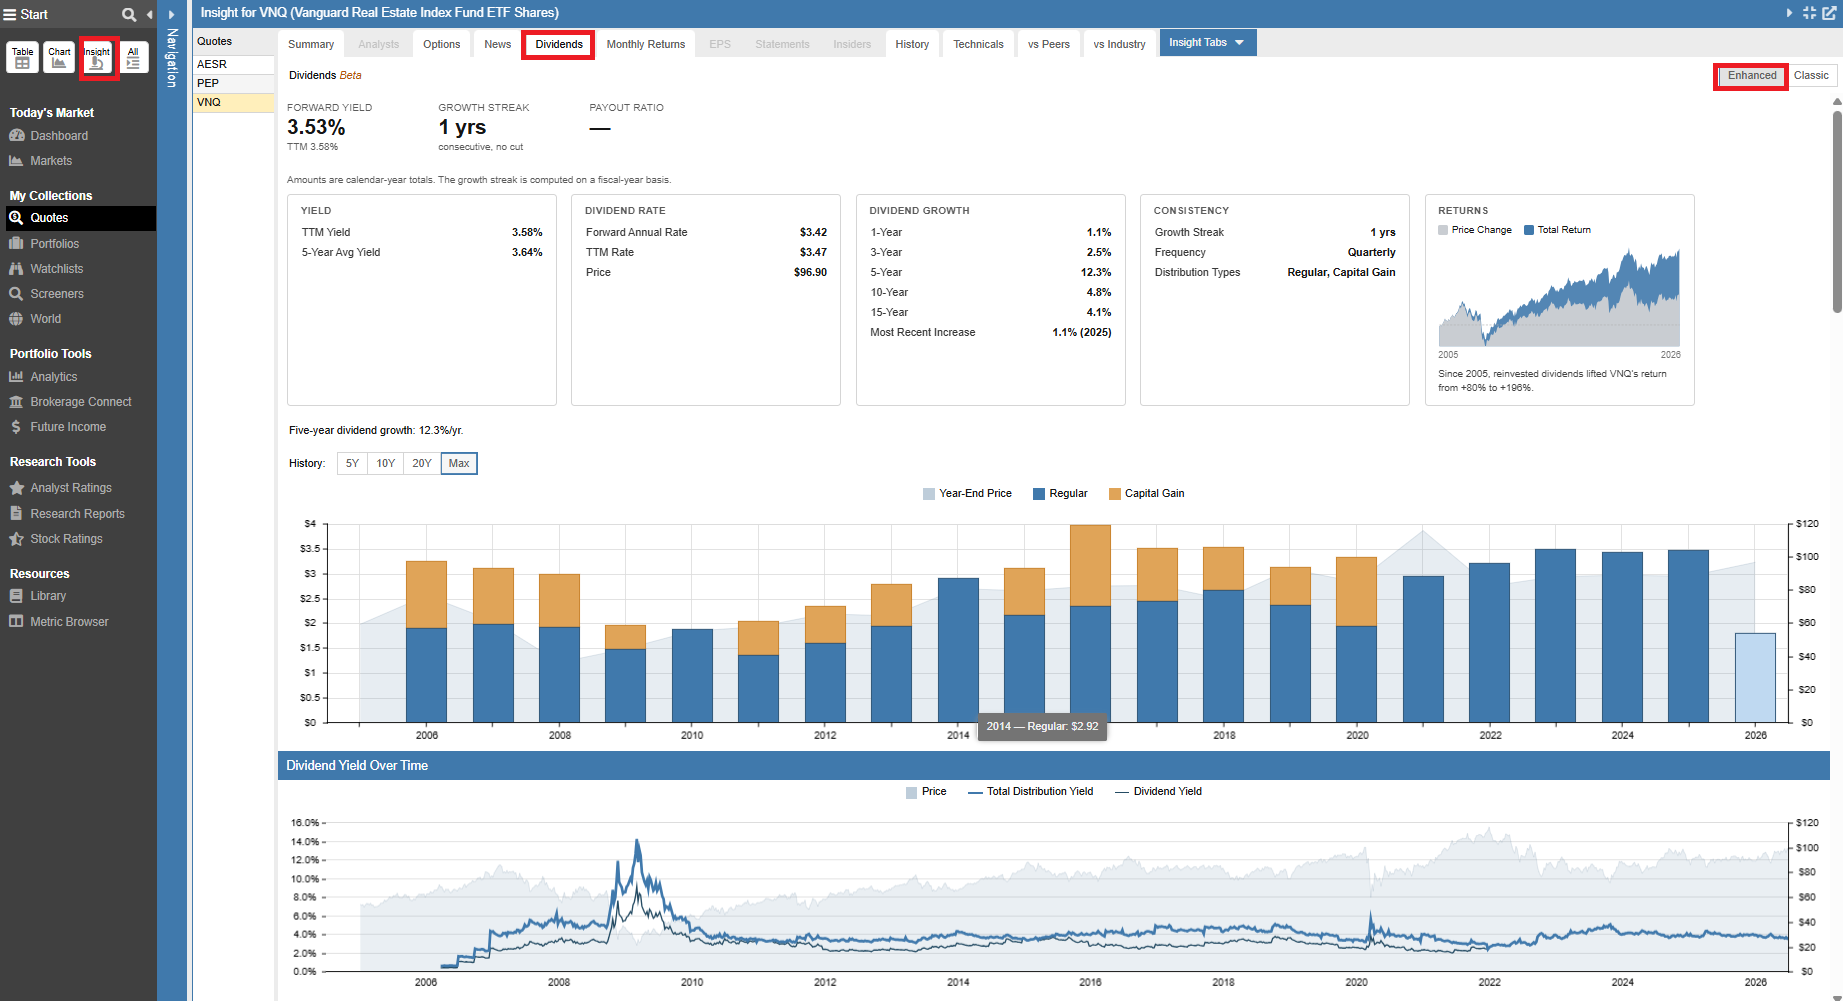
Visualize up to 30 years of payout history with the new Enhanced view in the Dividends tab [11].
Note: All subscribers can access the Enhanced Dividend tab for the Dow 30 stocks. Unrestricted access to the Enhanced view for all equities is available to Ultimate and Ultimate Pro subscribers.
Investor Warnings for ETFs and Funds
Similar to our highly popular stock warnings, V12 now features automated Investor Warnings specifically engineered for ETFs and Mutual Funds. These warnings are fully integrated into the Insight Panel and are available exclusively to Ultimate and Ultimate Pro subscribers.
The system runs automated checks for structural risks: leverage, fund size, liquidity, costs, taxes, concentration, index tracking, and volatility. Below is a breakdown of the specific warnings Stock Rover identifies:
| Warning Name | Description |
|---|---|
| Leveraged / Inverse Fund | Serious warning that fires when a fund carries leverage or inverse exposure. Displays the leverage reset frequency for both ETFs and mutual funds. |
| Small Fund Assets | Flags ETFs with net assets under $50 million, highlighting potential closure or liquidation risk. Escalates to a caution if under $25 million. |
| Low Trading Volume | Flags ETFs with an average dollar volume under $1 million per day, which can lead to wider bid ask spreads. Escalates to a caution if under $100k per day. |
| High Expense Ratio | Identifies ETFs and mutual funds with an expense ratio above 1.0%. Escalates to a caution if the ratio exceeds 1.75%. |
| High 12b 1 Fee | Flags mutual funds carrying a 12b 1 (marketing and distribution) fee of at least 0.50%. Escalates to a caution if 0.75% or higher. |
| Loose Index Tracking | Warns when a single asset class index fund strays from its stated benchmark, indicated by a best fit 3 year R² between 0 and 90%. Escalates to a caution if R² falls below 80%. |
| Wide Premium / Discount | Flags ETFs where the 1 year average premium/discount exceeds ±0.5%, or if the 1 year range is wider than 4 points. Escalates to a caution if the average exceeds 1.5% or the band exceeds 8 points. |
| High Tax Cost | Identifies ETFs and mutual funds with a 3 year Morningstar tax cost ratio above 2%. Escalates to a caution if above 3%. |
| Concentrated Portfolio | Warns when an ETF or mutual fund’s top 10 holdings account for over 60% of its total assets. Escalates to a caution if concentration exceeds 75%. |
| High Volatility | Flags ETFs and mutual funds with 1 year volatility above the 75th percentile of the investable universe. Escalates to a caution if above the 90th percentile. |
| Limited History | Notes when an ETF or mutual fund has been incepted within the last 3 years and does not yet have a Morningstar rating. |
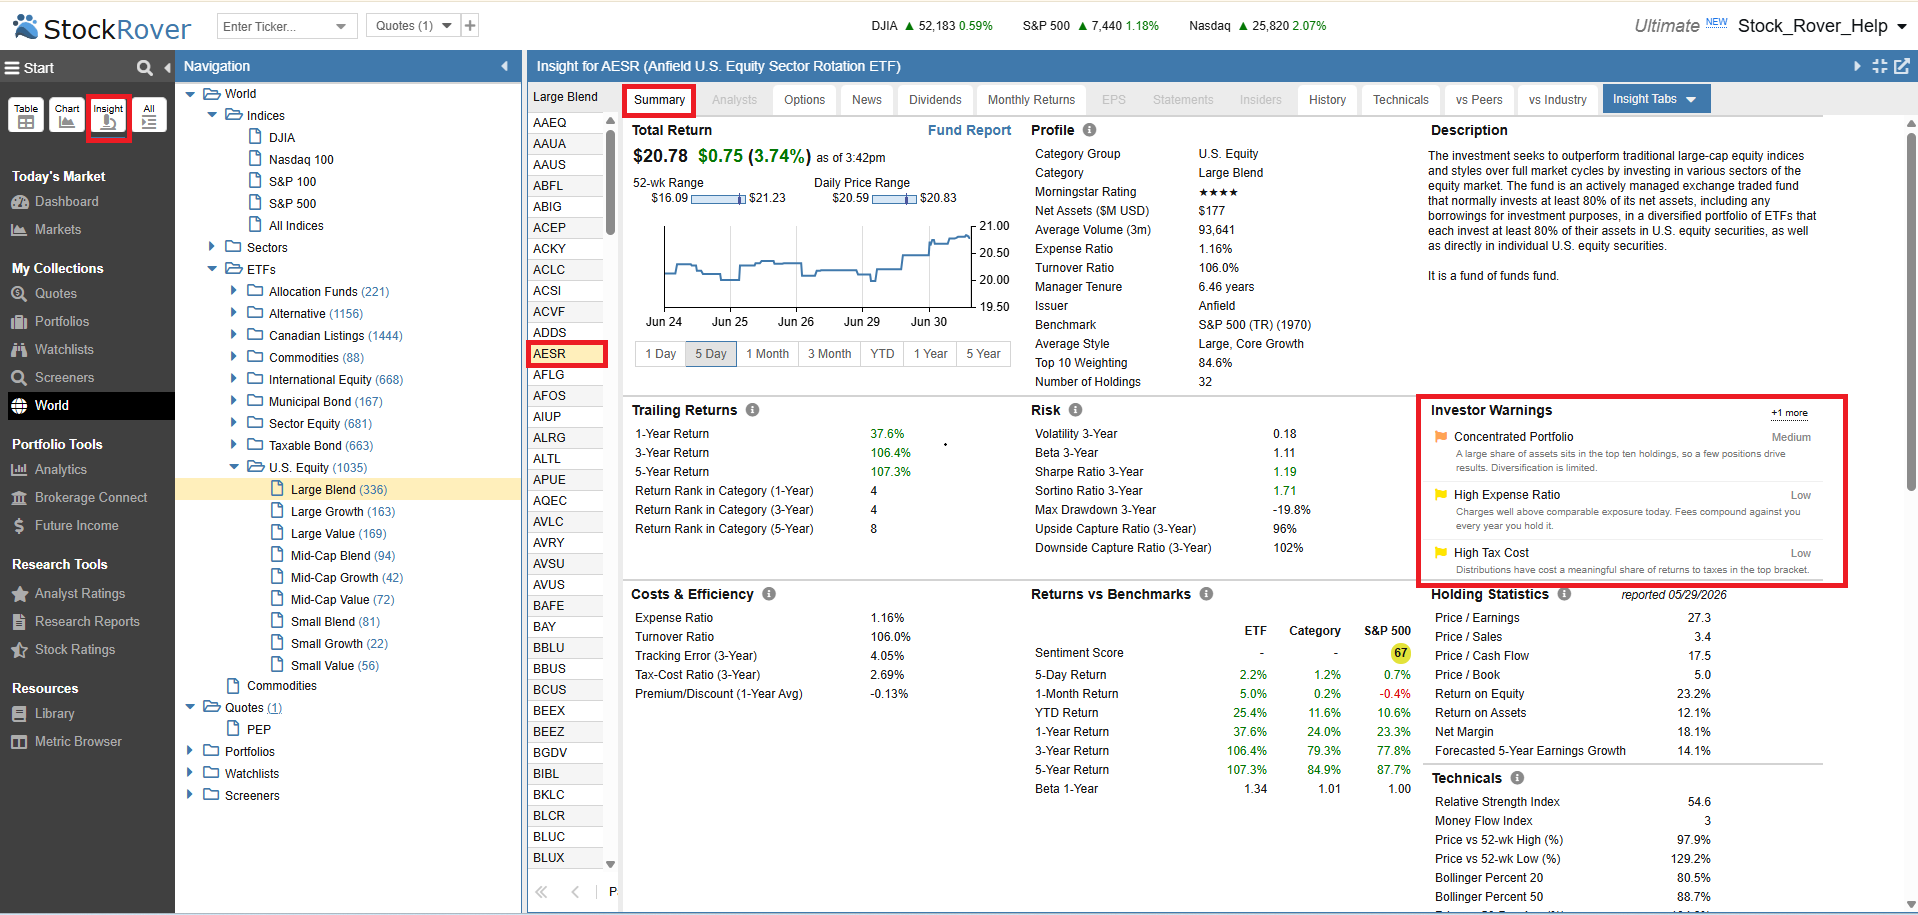
Investor Warnings are prominently displayed in the Insight Panel [12] for quick reference.
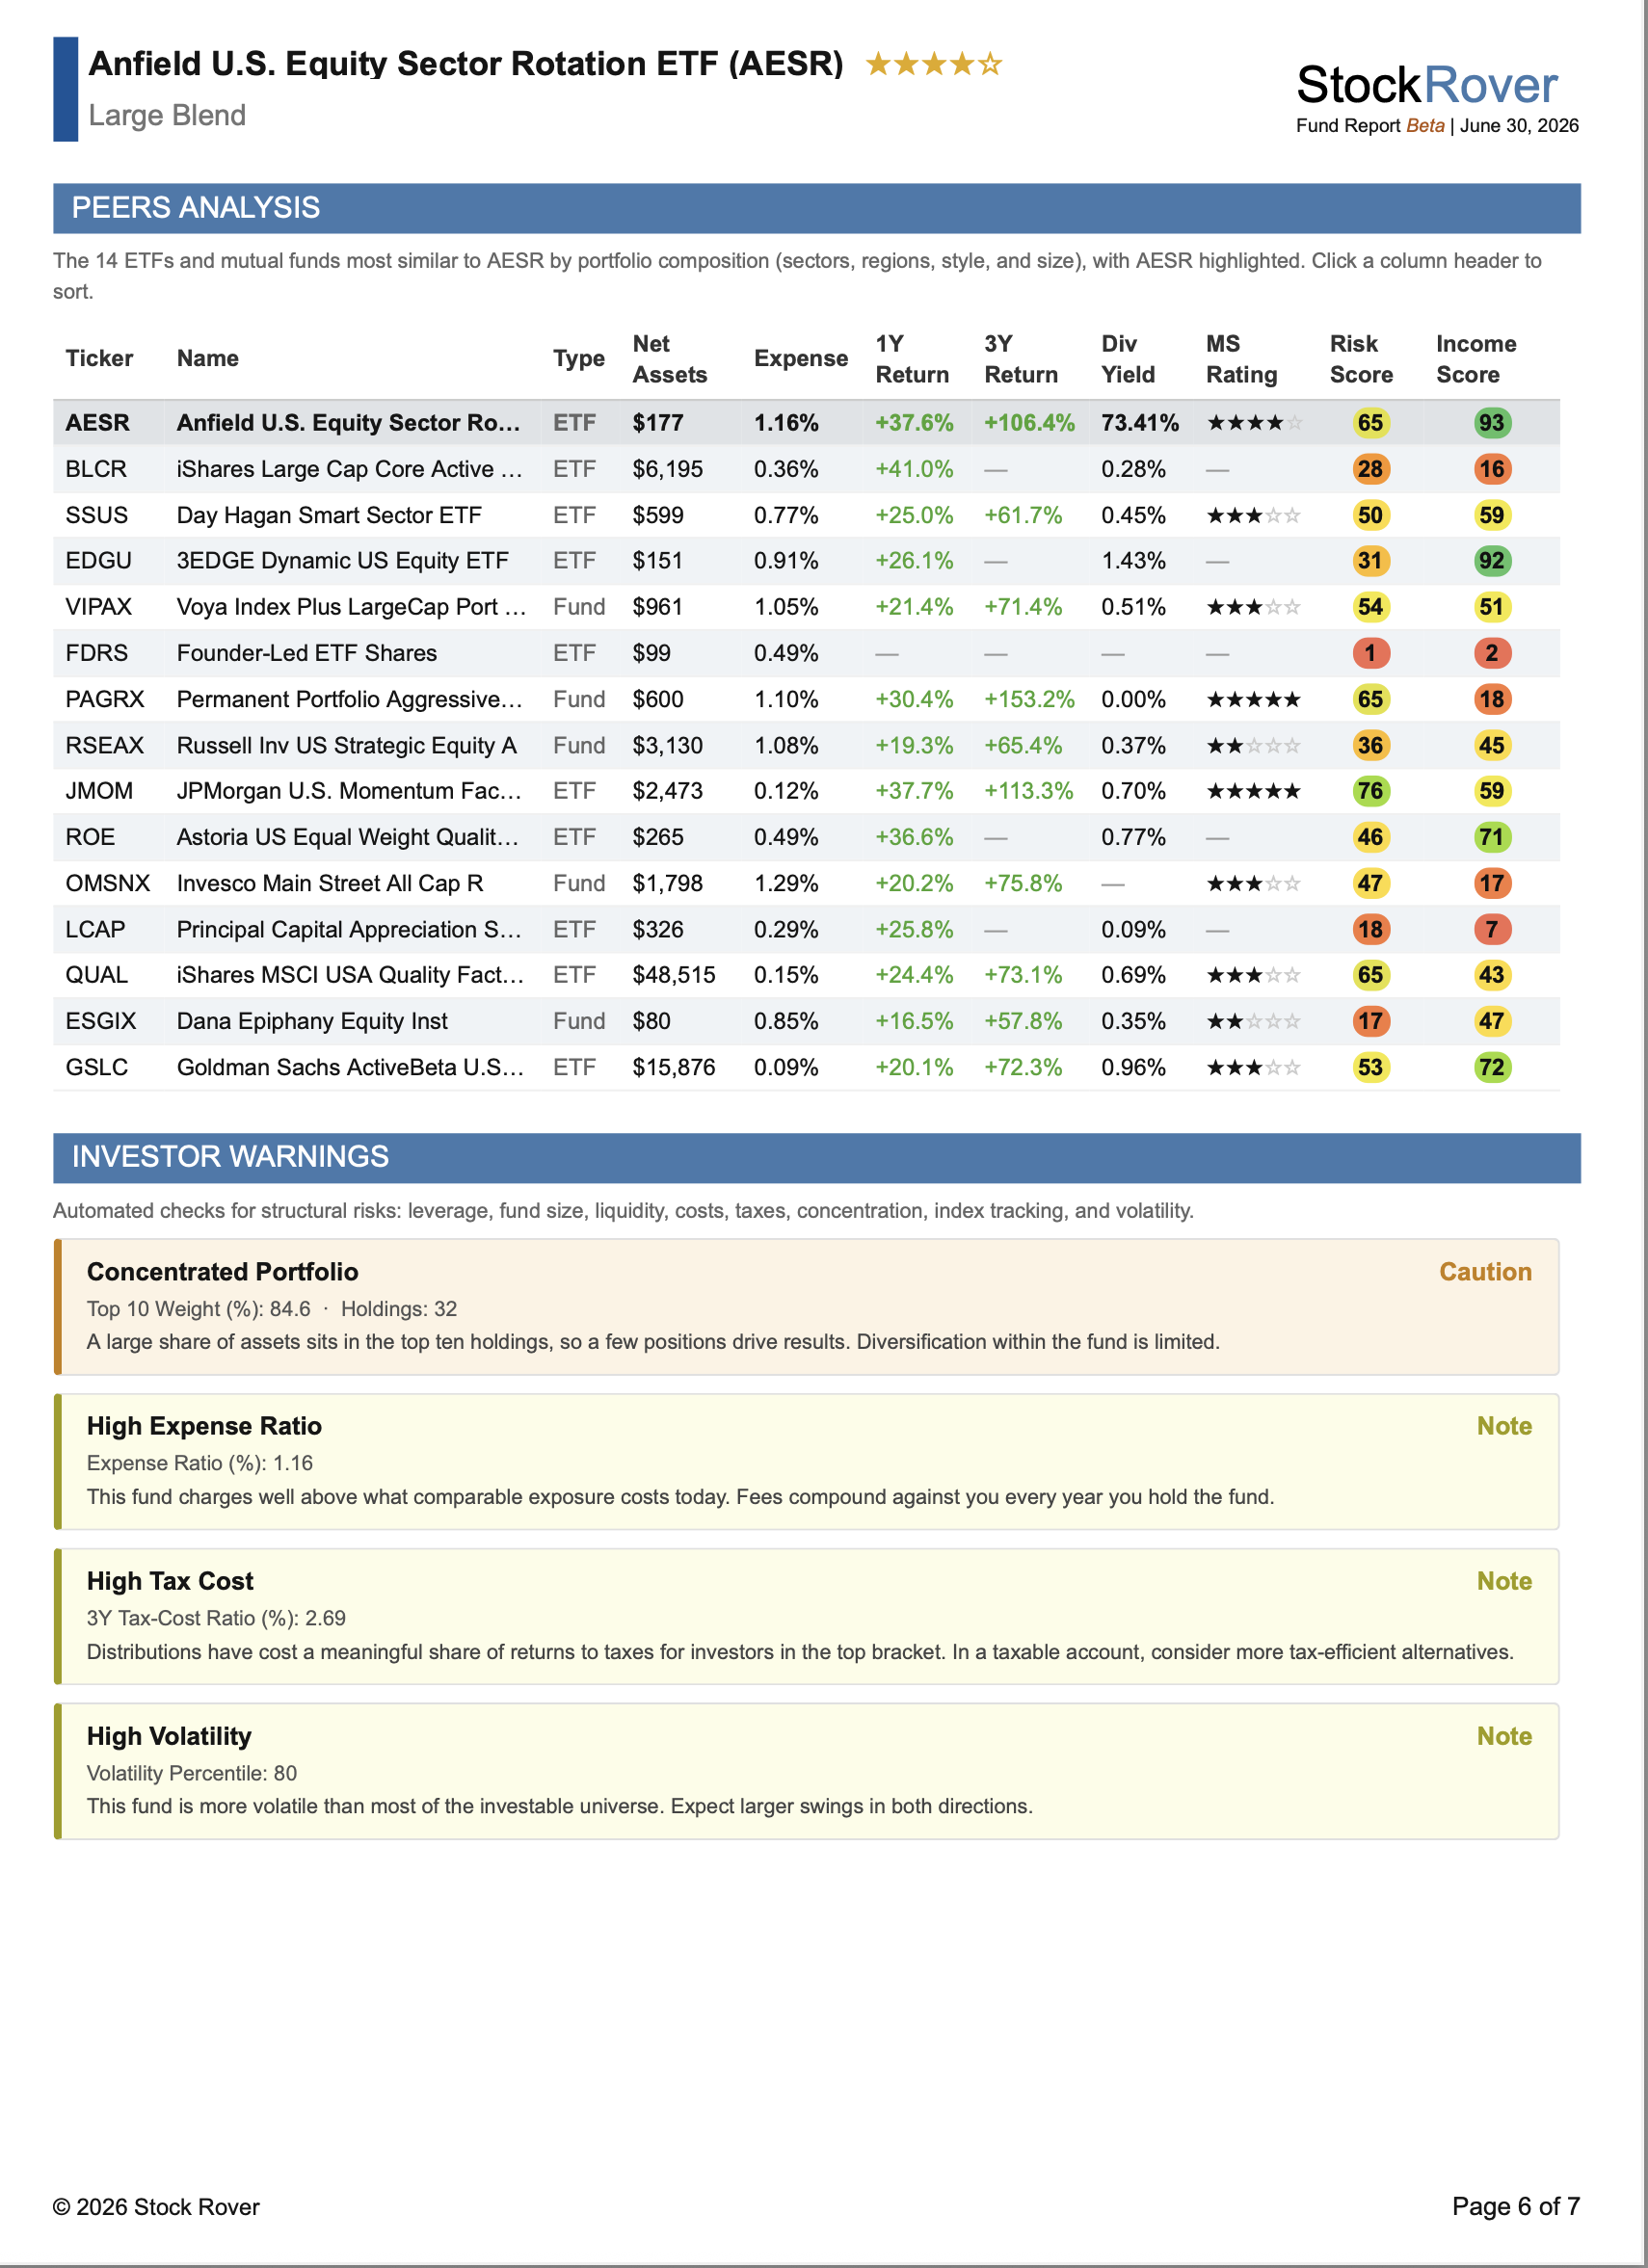
These automated checks are also fully detailed directly within the new comprehensive Fund Reports.
50+ New Advanced Metrics
To power these new displays and reports, we have expanded the Stock Rover data engine with 50+ new specialized metrics focused heavily on fixed income funds, distributions, and tax efficiency. While many of these additions are engineered specifically for ETFs and mutual funds, the new distribution and long term dividend metrics apply to individual stocks as well.
You can now screen and filter using deeply granular data points like Yield to Maturity, Effective Duration, Bond Style Box, and 1 to 5 year Tax Cost Ratios to see exactly how much of a fund’s return is being lost to taxes. We have also added long term income metrics across all equities, including the Dividend 20 Year Average Growth Rate and Total Distribution Yield.
Expanded Table Capacity
With the addition of over 50 new metrics to Stock Rover’s extensive data library, the ability to view more data side-by-side is incredibly valuable. To help you build even more robust data views, we have increased the Table’s maximum column limit from 35 to 45 columns for Ultimate and Ultimate Pro subscribers.
This expanded capacity makes it easier to compare investments in the Table [14]. You can now layer in new tax efficiency ratios, fixed-income data, and long-term dividend growth metrics right alongside your existing fundamental data without having to constantly swap columns in and out. For more details on customizing your workspace, review our documentation on adding columns to the Table [15].
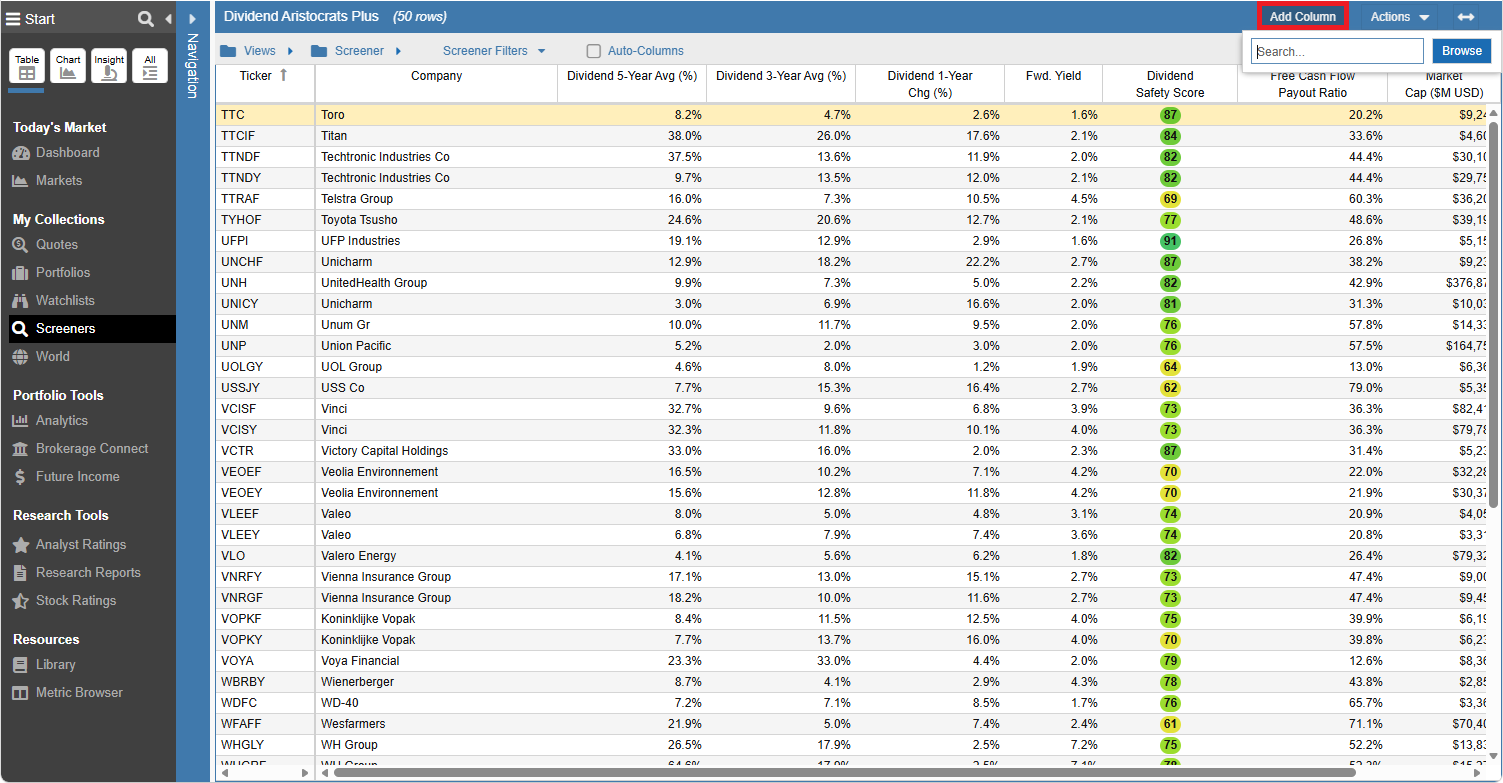
Ultimate subscribers can now load up to 45 distinct metric columns into a single Table view.
Summary
The Stock Rover V12 update brings powerful new analytics to your workflow. With comprehensive Fund Reports, an Enhanced Dividend display charting 30 years of history, automated Investor Warnings for funds, and over 50 new metrics, investors have unprecedented visibility into ETFs, mutual funds, and income generating assets. We invite you to log in and explore these new tools today.
Frequently Asked Questions
Who has access to the new Fund Reports?
All users can view sample reports for 12 specific tickers. Ultimate and Ultimate Pro subscribers have unrestricted access to generate deep dive reports for nearly 28,000 supported ETFs and mutual funds.
What is included in the Enhanced Dividend display?
The Enhanced view includes a new Summary dashboard with proprietary Safety Scores, a 30 year growth rate, and an interactive Yield Over Time chart mapping up to 30 years of payout history. All subscribers can access this view for the Dow 30, while unrestricted access to all equities is available to Ultimate and Ultimate Pro subscribers.
Which plans include the new Investor Warnings for funds?
While Stock Rover has long provided automated warnings for stocks to all subscribers, the new automated Investor Warnings specifically engineered for ETFs and Mutual Funds are available exclusively to Ultimate and Ultimate Pro subscribers.
How many metrics can I view in the Table at once?
With the V12 update, we have increased the Table’s maximum column limit from 35 to 45 columns exclusively for Ultimate and Ultimate Pro subscribers, allowing for even more comprehensive data views.
What kind of new metrics are included in the V12 update?
The V12 update adds over 50 specialized metrics focusing heavily on fixed income funds, distributions, and tax efficiency. Examples include Yield to Maturity, Tax Cost Ratios, and the Dividend 20 Year Average Growth Rate.