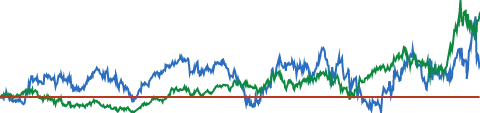
Dividend Adjusted Return
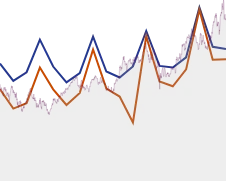
Oct 2, 2025 - Oct 2, 2026AAPL 333.69 (+31.1%)
Technology 128.32 (+37.0%)
S&P 500 7722.72 (+16.3%)
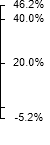

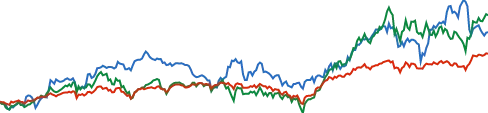



Stock Rover estimates Apple’s intrinsic (fair) value at $307.49, against a recent price of $333.69, a margin of safety of -8%. Quantitative scores (0–100): Value 64, Quality 78, Growth 92, Sentiment 47. Analyst consensus: Buy.

Fair Value | $307.49 | |
Margin of Safety | -8% |
Value Score 64 Value Score: Our value score looks at EV/EBITDA, P/E, P/S, P/TB (Price/Tangible Book) and EPS Predictability. P/S and P/TB are compared within a sector. Other metrics are compared across all stocks | Quality Score 78 Quality Score: Our quality score compares profitability and balance sheet metrics to find high quality companies using ROIC, Net Margin, Gross Margin, Interest Coverage, and Debt / Equity metrics. |
Growth Score 92 Growth Score: Our growth score looks at the 5 year history and the forward estimates for EBITDA, Sales, and EPS growth, ranking the best companies across all stocks. | Sentiment Score 47 Sentiment Score: Our sentiment score finds stocks in favor by analyzing Short Interest, returns in key periods over the last year, Price vs. 52-wk High, Days Since 52-wk High and MACD signals. |
| AAPL | Industry | S&P 500 | |
|---|---|---|---|
| Value Score | 64 | 53 | 69 |
| Price / Earnings | 38.3 | 39.3 | 26.6 |
| Price / Sales | 10.6 | 6.9 | 3.7 |
| Price / Free Cash Flow | 36.1 | 36.8 | 35.6 |
| Price / Book | 45.3 | 21.8 | 5.9 |
| Price / Tangible Book | 55.9 | 500+ | 363.9 |
| EV / EBITDA | 29.2 | 25.4 | 17.6 |
| EPS Predict. Pctl. | 98 | 54 | 71 |
| Piotroski F Score | 9 | 9 | 5 |
| 5‑Year P/E Range | 20.5 43.4 |
| 5‑Year P/B Range | 29.5 66.5 |
| 5‑Year P/S Range | 5.2 10.8 |
| AAPL | Industry | S&P 500 | |
|---|---|---|---|
| Growth Score | 92 | 52 | 79 |
| Sales Growth | |||
| Sales Growth Next Year | 10.5% | 10.5% | 22.5% |
| Sales 1‑Year Chg (%) | 12.2% | 15.8% | 21.1% |
| Sales 3‑Year Avg (%) | 6.8% | 6.9% | 14.5% |
| Sales 5‑Year Avg (%) | 5.0% | 5.9% | 12.7% |
| EPS Growth | |||
| Next Yr. Growth Est. | 8.6% | 8.5% | 13.1% |
| EPS 1‑Year Chg (%) | 16.9% | 21.1% | 40.6% |
| EPS 3‑Year Avg (%) | 12.5% | 12.1% | 19.1% |
| EPS 5‑Year Avg (%) | 9.2% | - | 14.6% |






NVDA | NVIDIA | $5,649,190 | 29.6 | 0.4% | 4.4% | 24.2% | 8% | 58 | 100 | 100 |
AAPL | Apple | $4,869,931 | 38.3 | 0.3% | 2.7% | 30.3% | -8% | 64 | 92 | 78 |
MSFT | Microsoft | $3,842,942 | 28.8 | 0.8% | 4.2% | 1.2% | -2% | 64 | 98 | 99 |
TSM | Taiwan Semiconductor | $2,452,061 | 34.4 | 0.8% | 14.1% | 65.8% | 4% | 62 | 100 | 99 |
AVGO | Broadcom | $1,695,306 | 45.4 | 0.7% | -3.1% | 5.8% | 8% | 54 | 100 | 97 |
SKHY | SK hynix | $1,387,521 | 12.4 | - | 18.3% | - | 14% | 65 | - | 100 |
MU | Micron Technology | $1,213,973 | 14.5 | 0.1% | 12.4% | 485.9% | 25% | 64 | 99 | 100 |
AMD | Advanced Micro Devices | $1,034,842 | 161.7 | - | 38.7% | 273.5% | -27% | 46 | 100 | 94 |
ASML | ASML Holding | $717,233 | 60.6 | 0.5% | 11.0% | 82.5% | 3% | 58 | 97 | 86 |
INTC | Intel | $630,790 | - | - | 32.5% | 219.9% | -26% | 49 | 61 | 42 |
DELL | Dell Technologies | $357,657 | 32.7 | 0.5% | 14.3% | 286.6% | -9% | 61 | 99 | 79 |
SONY | Sony Group | $139,235 | 19.7 | 0.7% | -3.4% | -14.8% | 6% | 86 | 53 | 82 |
| AAPL | Industry | S&P 500 | |
|---|---|---|---|
| Quality Score | 78 | 57 | 76 |
| Gross Margin | 48.7% | 40.2% | 33.0% |
| Operating Margin | 33.2% | 23.4% | 17.0% |
| Net Margin | 27.6% | 18.2% | 13.9% |
| Return on Assets | 35.3% | 33.2% | 15.7% |
| Return on Equity | 119.9% | 117.1% | 40.6% |
| ROIC | 71.5% | 67.5% | 32.3% |
| AAPL | Industry | S&P 500 | |
|---|---|---|---|
| Sentiment Score | 47 | 46 | 60 |
| 5‑Day Return | -2.2% | -2.0% | -0.3% |
| 1‑Month Return | 2.7% | 2.1% | 1.0% |
| YTD Return | 23.1% | 19.0% | 13.7% |
| 1‑Year Return | 30.3% | 25.0% | 16.2% |
| 3‑Year Return | 94.6% | 86.5% | 86.8% |
| 5‑Year Return | 139.8% | 117.8% | 89.6% |
| Beta 1‑Year | 0.69 | 0.63 | 1.00 |




| AAPL | Industry | |
|---|---|---|
| Forward Dividend Yield | 0.3% | 0.3% |
| Payout Ratio | 12.0% | 12.2% |
| TTM Yield | 0.3% | - |
| Fwd. Div. Per Share | $1.08 | $1.00 |
| Div. 1Y Chg (%) | 3.8% | - |
| Div. 3Y Avg (%) | 4.0% | - |
| Div. 5Y Avg (%) | 4.2% | - |
| Cons. Growth Years | 10+ | - |
| Div. Coverage Ratio | 8.1 | 7.4 |
| Current Ratio | 1.0 |
| Quick Ratio | 0.9 |
| Price | $333.69 |
| Net Cash Per Share | -$1.51 |
| Equity Per Share | $7.36 |
| Debt / Equity | 0.8 |
| Solvency Ratio | 64% |
| Short % of Float | 0.9% |
| Altman Z‑Score | 13.2 |
| Current Quarter EPS | |
|---|---|
# Up Last 30 days | 7.00 |
# Down Last 30 days | 14.00 |
Mean Estimate | 1.98 |
% Change (30 Days) | 0.05% |
| Next Quarter EPS | |
|---|---|
# Up Last 30 days | 1.00 |
# Down Last 30 days | 1.00 |
Mean Estimate | 2.91 |
% Change (30 Days) | -0.09% |
| Cur Qtr | Next Qtr | Cur Year | Next Year | |
|---|---|---|---|---|
| Latest | $1.98 | $2.91 | $8.82 | $9.58 |
| 30 Days Ago | $1.98 | $2.91 | $8.81 | $9.53 |
| 90 Days Ago | $2.01 | $2.95 | $8.76 | $9.68 |
| % Change (90 Days) | -1.5% | -1.4% | 0.7% | -1.1% |
| Surprise Type | Amount | Percent |
|---|---|---|
| Positive Quarters (> 2%) | 9 | 75.0% |
| Negative Quarters (< 2%) | 0 | - |
| In-Line Quarters (within 2%) | 3 | 25.0% |
| Surprise Type | Announce Date | Period End Date | Actual EPS | Est. EPS | Surprise (%) |
|---|---|---|---|---|---|
| In-Line | 07/30/26 | 06/30/26 | $1.91 | $1.88 | 1.6% |
| Positive | 04/30/26 | 03/31/26 | $2.01 | $1.92 | 4.7% |
| Positive | 01/29/26 | 12/31/25 | $2.84 | $2.65 | 7.2% |
| Positive | 10/30/25 | 09/30/25 | $1.85 | $1.73 | 6.9% |
| Positive | 07/31/25 | 06/30/25 | $1.57 | $1.42 | 10.6% |
| Positive | 05/01/25 | - | $1.65 | $1.61 | 2.5% |
| AAPL | Industry | S&P 500 | |
|---|---|---|---|
| Best Monthly Return (5Y) | 17.0% | 16.5% | 9.6% |
| Worst Monthly Return (5Y) | -12.5% | -13.6% | -9.6% |
| Beta 1‑Year | 0.69 | 0.63 | 1.00 |
| Volatility 1‑Year | 0.24 | 0.22 | 0.13 |
| Volatility 1Y Pctl. | 23 | - | - |
| Max Drawdown 1‑Year | -13.8% | -15.4% | -8.8% |
| Max Drawdown 3‑Year | -33.4% | -34.0% | -18.7% |
| Max Drawdown 5‑Year | -33.4% | -34.6% | -24.6% |










NVDA | NVIDIA | 100 | 105.9% | 127.8% | 66.0% | 83.4% | 109.9% | 69.0% |
MSFT | Microsoft | 93 | 17.8% | 31.8% | 19.5% | 12.9% | 15.0% | 13.5% |
TSM | Taiwan Semiconductor | 92 | 36.1% | 77.4% | 34.6% | 22.3% | 27.1% | 24.0% |
AAPL | Apple | 68 | 16.4% | 28.7% | 10.5% | 12.2% | 6.8% | 5.0% |
SONY | Sony Group | 31 | 8.3% | 35.0% | -0.7% | 3.8% | 2.1% | 5.8% |
SONY | Sony Group | 88 | 19.7 | 16.9 | 2.5 | 1.7 | 2.7 | 10.4 24.4 |
TSM | Taiwan Semiconductor | 88 | 34.4 | 21.6 | 1.1 | 17.2 | 12.2 | 11.7 44.0 |
NVDA | NVIDIA | 65 | 29.6 | 14.9 | 0.3 | 18.8 | 24.7 | 25.4 273.0 |
MSFT | Microsoft | 29 | 28.8 | 21.9 | 1.9 | 11.6 | 8.7 | 20.8 42.6 |
AAPL | Apple | 15 | 38.3 | 34.9 | 4.2 | 10.6 | 45.3 | 20.5 43.4 |
AAPL | Apple | 100 | 48.7% | 33.2% | 27.6% | 115.1% 197.0% | 26.9% 35.3% |
MSFT | Microsoft | 100 | 67.9% | 46.8% | 40.3% | 28.9% 44.5% | 18.2% 21.9% |
NVDA | NVIDIA | 100 | 74.7% | 65.2% | 63.7% | 19.5% 95.7% | 10.2% 89.3% |
TSM | Taiwan Semiconductor | 97 | 64.2% | 56.1% | 49.9% | 23.9% 34.5% | 16.1% 27.5% |
SONY | Sony Group | 73 | 31.8% | 13.3% | -1.7% | -4.0% 15.6% | 2.5% 4.8% |
TSM | Taiwan Semiconductor | 97 | 0.2 | 227.0 | 2.3 | 0.3% | 105% | 0.6% |
NVDA | NVIDIA | 94 | 0.2 | 497.2 | 3.8 | 7.5% | 245% | 1.3% |
MSFT | Microsoft | 86 | 0.1 | 55.4 | 1.1 | 18.2% | 80% | 0.9% |
AAPL | Apple | 77 | 0.8 | - | 0.9 | 5.3% | 64% | 0.9% |
SONY | Sony Group | 20 | 0.2 | 37.6 | 1.0 | 14.8% | 14% | 0.2% |
TSM | Taiwan Semiconductor | 82 | 0.8% | 0.8% | $472.78 | $3.78 | 5 | 25.2% |
NVDA | NVIDIA | 77 | 0.4% | 0.2% | $233.95 | $1.00 | 3 | 3.5% |
AAPL | Apple | 52 | 0.3% | 0.3% | $333.69 | $1.08 | 10+ | 12.0% |
MSFT | Microsoft | 51 | 0.8% | 0.7% | $517.53 | $3.92 | 10+ | 19.8% |
SONY | Sony Group | 26 | 0.7% | 0.7% | $23.82 | $0.16 | 10+ | - |
TSM | Taiwan Semiconductor | 97 | 14.1% | 9.2% | 40.1% | 56.8% | 65.8% | 2.17 | 0.39 | 98.7% |
NVDA | NVIDIA | 95 | 4.4% | 20.2% | 32.2% | 25.7% | 24.2% | 1.88 | 0.37 | 98.4% |
AAPL | Apple | 94 | 2.7% | 8.2% | 30.6% | 23.1% | 30.3% | 0.69 | 0.24 | 96.6% |
MSFT | Microsoft | 93 | 4.2% | 32.8% | 39.1% | 7.7% | 1.2% | 0.96 | 0.32 | 93.5% |
SONY | Sony Group | 75 | -3.4% | 14.6% | 12.7% | -6.6% | -14.8% | 0.76 | 0.29 | 78.5% |



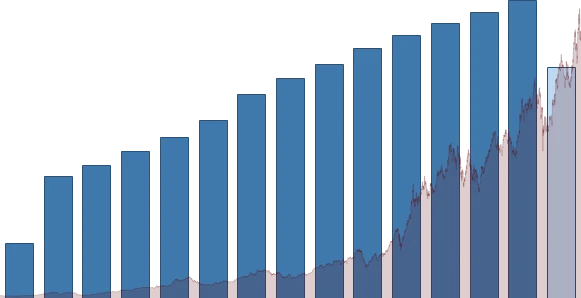
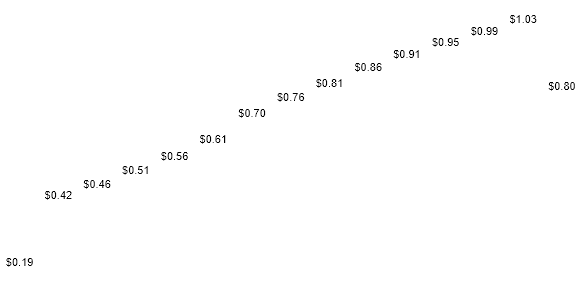


2026 Dividends | $0.80 |
08/10/26 | 08/13/26 | Regular | $0.27 |
05/11/26 | 05/14/26 | Regular | $0.27 |
02/09/26 | 02/12/26 | Regular | $0.26 |
2025 Dividends | $1.03 |
11/10/25 | 11/13/25 | Regular | $0.26 |
08/11/25 | 08/14/25 | Regular | $0.26 |
05/12/25 | 05/15/25 | Regular | $0.26 |
02/10/25 | 02/13/25 | Regular | $0.25 |
2024 Dividends | $0.99 |
11/08/24 | 11/14/24 | Regular | $0.25 |
08/12/24 | 08/15/24 | Regular | $0.25 |
05/10/24 | 05/16/24 | Regular | $0.25 |
02/09/24 | 02/15/24 | Regular | $0.24 |
2023 Dividends | $0.95 |
11/10/23 | 11/16/23 | Regular | $0.24 |
08/11/23 | 08/17/23 | Regular | $0.24 |
05/12/23 | 05/18/23 | Regular | $0.24 |
02/10/23 | 02/16/23 | Regular | $0.23 |
2022 Dividends | $0.91 |
11/04/22 | 11/10/22 | Regular | $0.23 |
08/05/22 | 08/11/22 | Regular | $0.23 |
05/06/22 | 05/12/22 | Regular | $0.23 |
02/04/22 | 02/10/22 | Regular | $0.22 |
Ex-Dividend Date | 08/10/26 |
Payment Date | 08/13/26 |
Amount | $0.27 |
Type | Regular |
Regular Dividend | $0.27 |
Forward Dividend Rate | $1.08 |
Forward Dividend Yield | 0.3% |
Trailing 12 Months Dividends | $1.06 |
Trailing 12 Months Yield | 0.3% |
Payout Ratio | 12.0 |
Dividend Coverage Ratio | 8.1 |
Consecutive Growth Years | 10+ |
3 Year Growth Rate | 4.0% |
5 Year Growth Rate | 4.2% |
10 Year Growth Rate | 6.6% |
 | 378,323 | 387,537 | 385,706 | 395,760 | 435,617 | 466,823 | 4.5% |
 | 116,903 | 113,965 | 118,658 | 125,675 | 141,070 | 154,859 | 6.1% |
 | 100,555 | 95,171 | 100,913 | 96,150 | 117,777 | 128,930 | 5.4% |
 | $6.03 | $5.89 | $6.42 | $6.30 | $7.90 | $8.72 | 8.1% |
 | 16,716 | 16,185 | 15,718 | 15,302 | 14,920 | 14,779 | -2.6% |
 | 31.7 | 21.3 | 31.4 | 41.2 | 36.4 | 38.3 | 4.1% |
 | 63,913 | 51,355 | 73,100 | 53,775 | 66,907 | 62,399 | -0.5% |
 | 153,154 | 128,777 | 143,692 | 133,240 | 158,104 | 149,818 | -0.5% |
 | 39,245 | 42,951 | 43,666 | 46,069 | 50,159 | 51,431 | 5.9% |
 | 5,580 | -8,509 | 9,719 | -11,125 | -4,263 | 492 | -40.0% |
 | 58,885 | 59,755 | 34,940 | 43,024 | 23,602 | 21,945 | -18.8% |
 | 71,932 | 56,727 | 74,100 | 66,758 | 88,190 | 107,520 | 8.8% |
 | 112,241 | 109,190 | 116,433 | 108,294 | 135,472 | 146,724 | 5.8% |
 | -10,388 | -11,692 | -9,564 | -9,995 | -12,148 | -10,041 | 0.7% |
 | 101,853 | 97,498 | 106,869 | 98,299 | 123,324 | 136,683 | 6.4% |
 | $6.09 | $6.02 | $6.80 | $6.42 | $8.27 | $9.25 | 9.2% |
 | 30.9% | 29.4% | 30.8% | 31.8% | 32.4% | 33.2% | 1.5% |
 | 28.7% | 26.9% | 29.3% | 27.8% | 33.7% | 35.3% | 4.5% |
 | 139.8% | 167.8% | 136.2% | 144.0% | 133.5% | 119.9% | -3.2% |
 | 52.9% | 52.2% | 58.4% | 56.2% | 69.5% | 71.5% | 6.5% |
 | $0.86 | $0.91 | $0.95 | $0.99 | $1.03 | $1.08 | 4.8% |
 | 0.5% | 0.7% | 0.5% | 0.4% | 0.4% | 0.3% | -8.6% |
 | - | 5.2% | 4.4% | 4.2% | 4.0% | 5.9% | - |
 | 7.0x | 6.5x | 6.8x | 6.4x | 7.7x | 8.3x | 3.7% |
Price / Earnings |  | 38.3 | 39.0 | 34.5 | 29.2 | 22.8 |
Price / Cash Flow |  | 33.6 | 34.6 | 29.6 | 24.9 | 18.5 |
Price / Book |  | 45.3 | 58.0 | 51.8 | 45.3 | 38.3 |
Price / Tangible Book |  | 55.9 | 51.5 | 60.2 | 43.5 | 43.5 |
Price / Sales |  | 10.6 | 9.5 | 9.1 | 7.2 | 5.9 |
EV / EBITDA |  | 25.4 | 26.6 | 25.8 | 21.8 | 17.4 |
Forward Dividend Yield |  | 0.3% | 0.4% | 0.4% | 0.6% | 0.7% |
Shareholder Yield |  | 2.0% | 2.8% | 3.2% | 3.4% | 4.7% |
Gross Margin |  | 48.7% | 46.9% | 46.2% | 44.1% | 43.3% |
Net Margin |  | 27.6% | 26.9% | 24.0% | 25.3% | 25.3% |
Return on Assets |  | 35.3% | 32.4% | 26.9% | 28.2% | 28.2% |
Return on Equity |  | 119.9% | 151.9% | 164.6% | 156.1% | 197.0% |
ROIC |  | 71.5% | 67.3% | 54.1% | 56.0% | 52.9% |
Additional data provided by Zacks, Intrinio, Quandl, Yodlee, IEX Cloud









AAPL has underperformed its sector by -5.9% in the past year.
The Technology sector has outperformed the market by 20.7% in the past year.