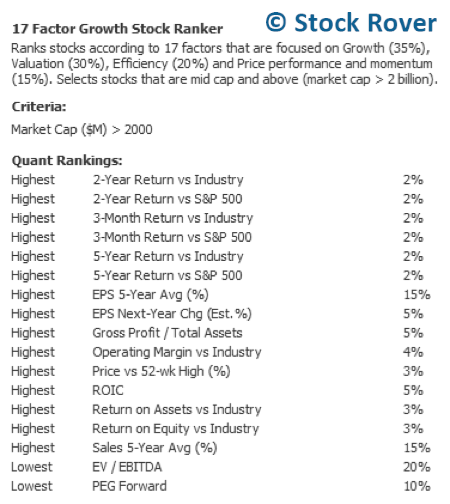
Priceline (PCLN) first came to my attention when Stock Rover CEO Howard Reisman chose it as one of his Top 5 [1] large cap growth stocks (as mentioned in my previous article [2]). In fact, it lands in second place when applying Howard’s personalized “17 Factor Growth Stock Ranker” screener to his “Twelve Strong Large Cap Growth Stocks” watchlist—the screener and the watchlist can both be imported into your account [3] from the Stock Rover library. Please note the screener is a ranked screener and requires a Premium subscription.
Here is the criteria by which the screener operates:
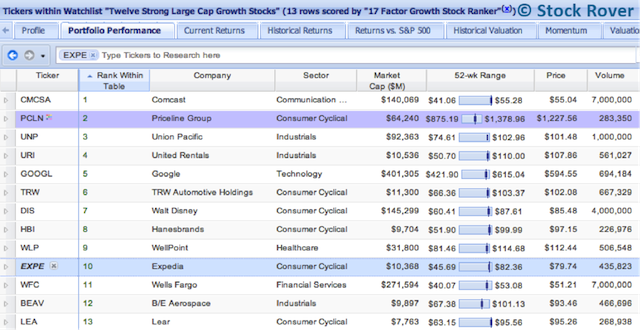
However, as a traveler I have always used Priceline’s main online travel agency (OTA) competitor, Expedia (EXPE), since oddly enough, Priceline has never really crossed my radar. When I added EXPE to Howard’s watchlist (below), it ranked 10th, not bad overall given that it is being compared to 12 strongly performing growth stocks, but still far behind PCLN.
 [4]
[4]
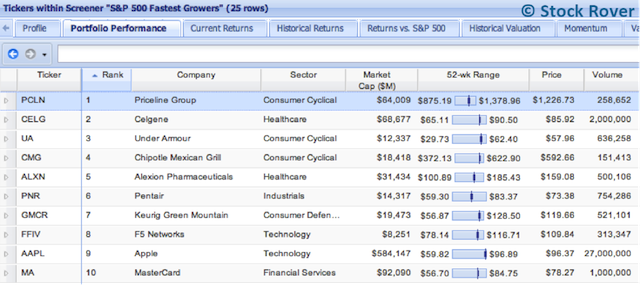
As further confirmation of their differences, Priceline ranks number one by Stock Rover’s “S&P 500 Fastest Growers” screener, while Expedia doesn’t even make the list.
 [5]
[5]
So I am wondering: Why does Priceline appear to be doing better than Expedia, a company of which I am a satisfied customer? Is it simply a better service, or is it just better positioned for growth? And can both companies, as the two largest OTAs in the world, sustain their high growth? To answer these questions, I did some further investigation.
Contents
- Destination Overview: The OTA Industry [6]
- Package Offerings: Business Structures [7]
- PCLN: [8]
- EXPE [9]
- Surveying Sales Growth [10]
- Exploring EPS Growth [11]
- Valuation: Is the Price Right? [12]
- (Price)Lining up the Numbers: Finances [13]
- Cruising Capital Efficiency [14]
- Trekking the Price Trails: Performance and Momentum [15]
- Growth Runway: The Journey to the Final Destination [16]
- Priceline [17]
- Expedia [18]
- Conclusion: Which itinerary should investors follow? [19]
Destination Overview: The OTA Industry
Before analyzing each company by itself, let’s look into the OTA industry as a whole for some background.
From the macro perspective, travel is something that will play an increasingly important role in our lives as the world becomes increasingly globalized. More and more, we aspire to travel for leisure, and we need to travel for business, so it is only natural that the travel industry will see continuous growth in the coming years. Coupled with the rapid growth of online and mobile consumer services, OTAs are therefore very well positioned. Moreover, OTAs benefit from a substantial network effect: the more customers they have, the more providers they can attract and vice versa.
However, there are also some considerable risks they face. First of all, the travel industry, and thus the OTA industry, is highly susceptible to fluctuations in the business cycle as well as geographic disturbances such as inclement weather or civil unrest. OTAs also face heavy competition, not just among themselves but also from travel search sites such as Google and TripAdvisor, daily deal sites like Groupon, social networking sites, local travel agencies, and hotels themselves, which are trying to direct more traffic to their own websites. Google’s recent venture into the OTA industry with its purchase of ITA Software, a company that develops algorithms for comparing airline ticket data, presents a particular threat, because many travel sites, Priceline and Expedia included, depend on ITA for their flight data. Furthermore, OTAs are currently underlegal scrutiny for their occupancy tax policies – the question of whether their revenue is taxable under tax ordinances that apply to hotels could have an impact on their after-tax earnings.
OTAs derive their revenue from two different business models, the merchant model and the agency model, as well as a small amount from advertising. In the merchant model, which is more established, travel agencies buy rooms/tickets/car rentals wholesale from their providers and then resell them at marked-up prices, taking over marketing functions for a 20% or more commission. Customers must pay upfront for their bookings in this model.
The agency model is emerging in popularity, as it has the potential to be more lucrative for travel agencies and is favored by customers who appreciate the choice of paying at checkout rather than when they book. In the agency model, OTAs simply get paid a commission in the low-to-mid teens when a customer books, but lower margins are balanced out by reduced service commitments from credit processing and payment collection. Priceline and Expedia have both adopted this model and are seeing higher growth from it than for their merchant businesses.
Package Offerings: Business Structures
With the industry as a whole in mind, let’s see what each company individually has to offer.
PCLN:
Priceline Group, Inc. offers hotel rooms, air tickets, rental cars, vacation packages, cruises, “things-to-do,” and travel insurance through the several sites under its umbrella. Booking.com, Priceline’s European accommodations booking site, is its main revenue driver and operates under the agency model, which in total accounted for 65% of Priceline’s revenue by sales in 2013 while the merchant model accounted for 33%. It currently offers 420,000 properties in 190 countries and operates in 42 languages. Priceline’s namesake U.S. site, Priceline.com, offers both price-disclosed and “Name Your Own Price” models for hotels, rental cars, and flights both separately and in packages. The NYOP model is aimed at cost-conscious customers, allowing Priceline to reach a greater customer base, and also helps companies dispose of excess inventory without affecting their retail prices. This model is opaque, meaning the company a customer is booking from is not revealed until the transaction is over and the bookings are nonrefundable. The opaque model, however, is waning in popularity with customers, since a stronger travel industry means that companies have less excess capacity and thus fewer available deals. Priceline now also offers “Express Deals,” which allow users to find discounts without bidding. Priceline’s other websites include rentalcars.com, travel meta-search website and mobile app Kayak, and Asian hotel booking service Agoda.com.
Priceline gets 80% of its bookings internationally and 15% domestically. It only holds 16% of the U.S. online travel market share, which is probably why I did not know much about it before, but it has a 31% share of the international travel market, which is growing much faster than the North American travel market. Priceline especially benefits from placement in a European market that not only has increasing penetration rates in comparison to the North American market but also a greater number of boutique hotels that are more likely to depend on OTAs for traffic. Finally, Priceline derives 3% of its revenue from advertisements, which has actually gone up 1992.6% year over year in 1Q14 due to its acquisition of Kayak (more on this later).
EXPE
Expedia, Inc. also offers a wide variety of travel products both in packages or on a stand-alone basis, with over 200,000 hotels and 300 airlines in 33 countries offered to over 50 million unique visitors to its websites. Its portfolio includes its main full-service Expedia.com business, Hotels.com, a hotel “expert” that offers premium content about lodgings, Hotwire.com, its opaque discount travel site, vacation package business Classic Vacations, local “things-do-to” advisor Expedia Local Expert, corporate travel full-service business Egencia, and Expedia Affiliate Network, which provides marketing and online booking services for its clients (airlines, hotels, etc.) Expedia has been expanding its international presence with European travel sites Venere.com and VIA Travels and popular online Chinese travel agency eLong.com as well as venturing into travel meta-search with trivago.com. Sales for leisure travel comprise 92% of Expedia’s revenue while sales for corporate travel contribute 8%. Expedia also uses both the merchant and agency models, with the Merchant model contributing 24% of its revenue by sales in 2013 while the agency model brought in 70%.
What really differentiates Expedia from Priceline is that it gets 53% of its revenue domestically, where it reigns dominant with an over 40% market share. 47% of its revenue comes from international bookings, but, as mentioned above, the international travel market is growing at faster rates while analysts see the North American travel market as nearly mature.
Surveying Sales Growth
So how does business structure translate into the numbers? Let’s first look at the yearly sales growth of each company, shown in the tables below:
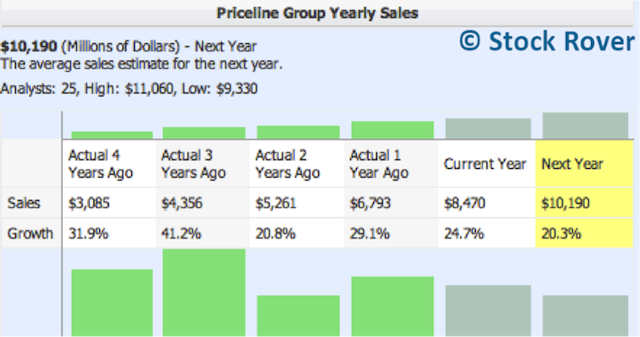
With growth rates substantially higher than Expedia’s (below) across all five years, Priceline’s prime placement in the international market is indeed paying off. In fact, in 2010, Priceline overtook Expedia as the world’s largest online travel agency by sales. To give a better sense of where Priceline’s growth is coming from, its international bookings increased 43% in 2013, compared to an increase in domestic bookings of just 16%. Its merchant business actually decreased by 0.3% year over year in 1Q14, in part due to the decline of the opaque model, while its agency business grew 3.2%. In addition, by volume, its hotel room nights were up 37%, its rental car days were up 36.8%, and its airline tickets were up 9.4% in 2013.
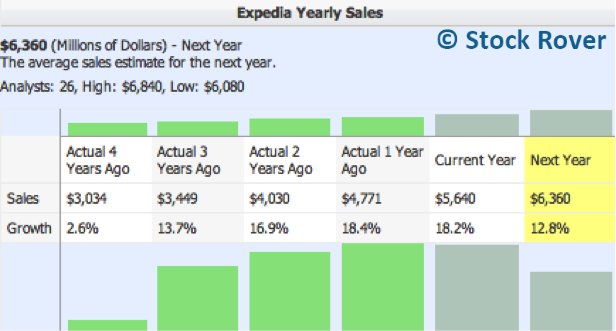
Expedia’s growth (above), though slower than Priceline’s, is still in the healthy double digits. It saw its international bookings grow 27.6% in 2013, compared to a domestic growth rate of 11.1%. Its agency business follows Priceline’s trend of faster growth, at 115.2%, while its merchant business grew at a still substantial 40.6%.
Its revenues for hotel nights increased 12% in 2013, as the result of a 24% increase in room night volume but a 10% decrease in revenue per night, and its revenues from airline tickets were up 28%. While Expedia.com, Hotels.com, and trivago.com were its strongest businesses, with trivago seeing a whopping 80% increase in revenue, Hotwire.com was its weakest link.
Both companies see more conservative sales growth estimates for the coming year, likely due to a revenue mix that is increasingly skewed towards the agency model and international business, where revenues per night are on average lower. Yet, these numbers are still in the double digits, driven by an improving economy and each company’s efforts to increase their offerings.
Exploring EPS Growth
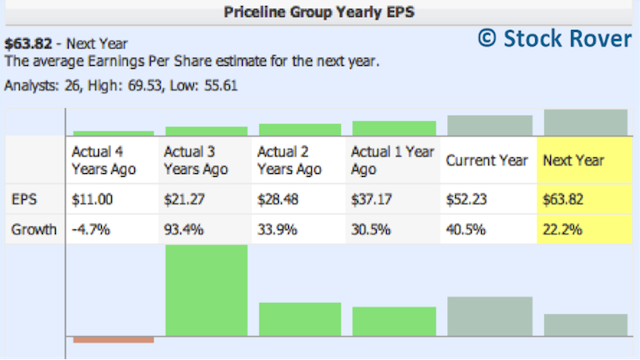
According to the table above, Priceline has seen very high earnings growth since 2011. Its next year’s expected EPS growth is at a still strong 22.2%, though this number is lower than it has been in previous years given plans for accumulating inventory, increasing personnel, and furthering advertising efforts that will compress margins.
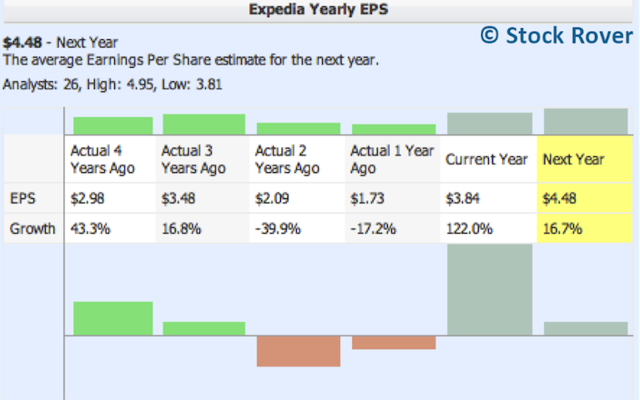
Expedia’s EPS growth (above) has fluctuated wildly during the past five years but is expected to grow at 16.7% next year. Its EPS growth rocketed up 122% for the current year from a slump in the past two years, which is in part due to the success of its trivago acquisition and its Expedia Traveler Preference Program (ETP) initiative that cut down costs (more on this later).
Valuation: Is the Price Right?
So, we can see clearly that both companies are growing. To see whether they are fairly priced for their growth, let’s examine some valuation metrics.
PCLN and EXPE have similar Price/Earnings and PEG ratios, with PCLN looking just a little bit cheaper. Given that the P/E ratio for the Internet Catalog & Retail industry is an astronomical 276.91, both companies are actually valued at very significant discounts to industry norms. However, EXPE looks significantly cheaper by the EV/EBITDA, Price/Sales, and Price/Cash Flow metrics.
Overall, it’s hard to say which stock is a better value, but given that we are focused on growth and PCLN is growing faster than EXPE yet has a marginally lower PEG forward, PCLN looks to me like a slightly better deal.
(Price)Lining up the Numbers: Finances
Seeking a better explanation for the valuation metrics, which don’t provide such a clear story, I checked Priceline and Expedia’s income statements and balance sheets over the last 10 years.
 [21]
[21]
Priceline’s income statement, above, looks exceptionally healthy. Its sales revenues have grown, while its cost of sales has actually decreased in recent years. All of its margins have also increased, especially its gross margin due to its continued transition toward the agency model, which has virtually no costs of revenue.
Expedia’s income statement (above) doesn’t look too bad either, but its numbers are not quite as good as Priceline’s. It has seen consistently increasing sales as well as sales costs, but while its current cost of sales is similar to Priceline’s, its sales are significantly lower. Its margins are also all significantly lower than Priceline’s, and its operating margins have fallen to the single digits since 2012. This reveals that Expedia is not as efficient in generating profits as Priceline is.
Let’s now look at the Balance sheets.
 [23]
[23]
Above, Priceline’s balance sheet reveals that its long-term debt has jumped from 0 in 2011, but its low debt/equity ratio of 0.3 assures investors that the balance sheet is still in very good shape.
 [24]
[24]
Expedia’s balance sheet (above), on the other hand, has a higher debt/equity ratio of 0.6, meaning that it is in a relatively riskier situation. This is reinforced by its long term debt, which is more than half the amount of its cash. Though Expedia isn’t in bad financial shape, it definitely isn’t as liquid as Priceline is, which could affect its ability to finance future growth initiatives.
Comparing each company’s investment spending, in the table below, we can see that Expedia is actually spending considerably more in all categories than Priceline.
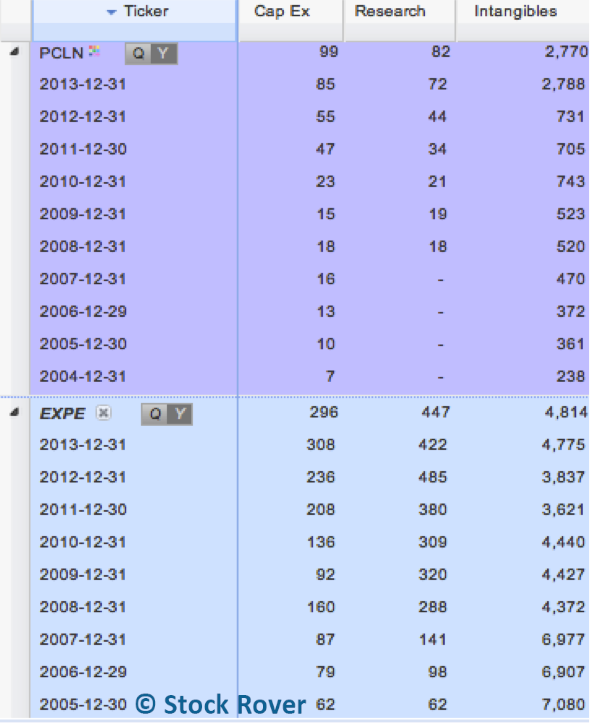
This makes sense, given that Expedia has a few more disparate brands under its name. It is currently working on increasing its inventory, especially in international markets, and has made several acquisitions over the past few years to broaden and diversify its market share, which helps explain its high level of intangible assets. Note that in 2013, Priceline’s intangibles also jumped dramatically, in most part due to its $2.1 billion acquisition of Kayak.
Cruising Capital Efficiency
But is Expedia’s heavy investment spending paying off? And is each company making effective use of their capital in order to turn profits for shareholders? The Return on Assets, Return on Equity, and Return on Invested Capital metrics can help answer these questions.
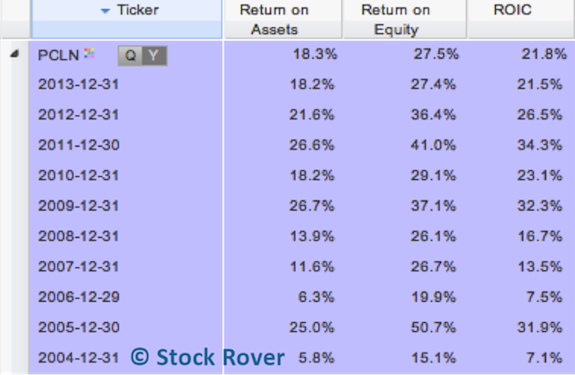
Priceline’s ROA, ROE, and ROIC (above) have fluctuated a bit, and though they are still pretty high, they have decreased recently.
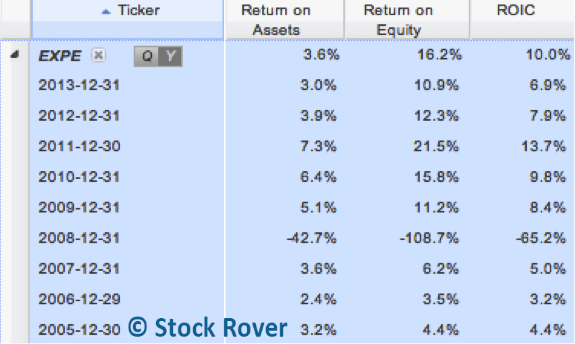
Expedia’s capital efficiency metrics (above) have also decreased. Moreover, they are much lower than Priceline’s.
I am pegging this trend on both companies’ appetite for acquisitions and large increases in expenditures lately, which have not yet translated into profits. Expedia, especially, has been spending more, as seen in the section above, while at the same time earning less than Priceline. However, part of its debt can be attributed to the $1.4 billion it has spent in share repurchases over the past four years to drive up shareholder value.
Trekking the Price Trails: Performance and Momentum
As seen in the table above, Priceline has performed better than Expedia and the S&P 500 in the long term, with an astonishing 5-year Return vs. S&P 500 of 798.1%. Interestingly enough, it has performed worse than the S&P 500 over the past 3 months.
Below, I charted Priceline and Expedia, with the S&P 500 set as a baseline (in red) over the past 3 months as well as the past 5 years.
Past 3 Months:
Past 5 Years:
PCLN has indeed been lagging behind the S&P 500 and Expedia over the past 3 months, but it is by far leading the pack when charted over the past 5 years. Thus, PCLN seems to have been losing momentum lately, perhaps due to the fact that high growth momentum stocks have been out of favor in the market recently. The very high absolute share price could also serve as a barrier to many potential investors, particularly retail investors. Overall, however, Priceline has inarguably outperformed Expedia over the long term. As its price trends away from its 52-week high, this may even present an opportunity for investors to buy.
Growth Runway: The Journey to the Final Destination
Expedia, by itself, seems be running a good business and expects continued high growth into the next year, but Priceline seems to be doing even better, outperforming in all the above categories. At this point, investors need to know whether both companies can sustain their current growth and also whether Expedia has a place in the OTA industry in the long run.
Though it is difficult to predict something like this, my research leads me to believe that both companies can indeed coexist, and even thrive, in the OTA market, at least for the next decade. I’ll lay out my evidence by company.
Priceline
Though it has wrested the title of the world’s largest online travel agency, Priceline currently fills only 7% of the total online market share of fillable rooms, so it still has a long growth runway ahead of it. In addition, it currently controls only 16% of the North American OTA market. Management has made efforts to expand its North American presence, with an offline advertising campaign for Booking.com that debuted in 2012.
Another avenue for growth is the rapid emergence of alternative lodgings, which currently make up 25% of Priceline’s inventory. These lodgings, including villas, guest houses, bed and breakfasts, hostels, and even houseboats, fill gaps in Priceline’s European business, where the hotel supply is limited. In addition to the listings on its Booking.com site, Priceline recently launched Villas.com [28], a vacation rentals site that now competes with other increasingly popular vacation rental marketplaces such as HomeAway and Airbnb. Aside from Europe, Priceline is also seeking to expand into the Asian travel market with its Agoda.com business and an alliance [29] with Chinese travel agency Ctrip.com for outbound travel from Asia.
Priceline’s biggest acquisition to date has been the $2.1 billion it paid for Kayak in May 2013, but this has proven to be a smart move so far, as Kayak brought in $69 million in revenue in just 1Q14, contributing 7% of Priceline’s inorganic revenue growth. Kayak has allowed Priceline to diversify its revenue mix to include travel media and advertising and also compete with other travel search sites such as Google and trivago. Priceline is also currently in the process of purchasing OpenTable.com, an online restaurant reservations company, in a $2.6 billion all-cash transaction. Given the close relationship between travel and dining, this makes sense for Priceline, and it also gives Priceline entry into another lucrative market. However, OpenTable faces stiff competition from immensely popular restaurant-ratings app Yelp (YELP), which is planning to offer free reservation services for restaurants, whereas OpenTable requires a commission.
Expedia
Expedia also has some enticing strategies for growth up its sleeve. It currently captures only 4% of the worldwide OTA market share, meaning it, too, has significant room to grow. In 2013, it acquired German travel meta-search site trivago.com for $625 million, which contributes to its business in much the same way Kayak does for Priceline. Trivago, too, has been a shrewd acquisition, growing 80% over the past year. Expedia is also seeking expand its European market share by acquiring Italy-based hotel and vacation rentals site Venere.com in 2008 and Nordic travel company VIA in 2012 and partnering with Accor, Europe’s leading hotel operator, to increase its European hotel inventory. Moving in on the Asian travel market, Expedia established an agreement with eLong, mainlaind China’s leading travel planning website, in 2012 to further expand hotel booking options for users. It also started a joint venture with AirAsia, Asia’s leading low-cost airline, in 2011 and a partnership [30] with Indian company Thomas Cook Visa & Passport Services to provide visa assistance services to its customers.
Expedia has also recently formed an eight-year agreement with Travelocity, another full-service travel planning site, in which Expedia provides content, inventory, customer service, and technology for Travelocity while Travelocity provides marketing services. In effect, this agreement removed Travelocity as one of Expedia’s competitors, essentially converting it into a marketing business, and allows Expedia to better compete with Priceline. In addition, Expedia debuted its Expedia Traveler Preference Program in 2012, which allows travelers to pay when checking out of hotels rather than at the outset. This shifts the responsibility of payment collection and credit card processing fees to hotels, which now invoice Expedia rather than Expedia invoicing them, but while this model is more costly for hotels, it also increases their traffic flow. Ultimately, the ETP initiative should improve Expedia’s margins and allow it to better compete with agency model players.
Conclusion: Which itinerary should investors follow?
Priceline and Expedia are both great businesses that each still have significant room to grow, but Priceline is currently better positioned with a larger share of the international OTA market. Since Priceline is moving in on the North American market and Expedia is aiming to grow internationally, the two businesses will no doubt run into each other, but due to prime positioning and strategic acquisitions, both should see continued growth in the years to come. Ultimately, however, with a stronger performance in all categories, Priceline provides a more enticing package for investors.


