A few weeks ago we told you about our expanded ETF data and capabilities, which are a part of Stock Rover’s V7 beta. Over the next few weeks, we’ll highlight some of the other awesome features that are newly available in V7.
This post showcases the productivity-boosting features Notes and Comments, as well as Custom Metrics, a popular user wishlist item that is now a reality.
These are open-ended features that are meant to be used in a way that is personal to you and most effective for you. There is no right way or wrong way to use them. So with that in mind, let’s dive in!
First, Enter V7
To try out the features described here, you must enable V7 from your Stock Rover account in one simple step. Select “Try V7 Beta” from your account dropdown menu, and you will be transported into the future of Stock Rover.
Notes and Comments (Premium)
As you’re combing through data and deciding how to invest, it’s very helpful to jot down notes and observations. Stock Rover now offers two handy methods for keeping track of your thoughts.
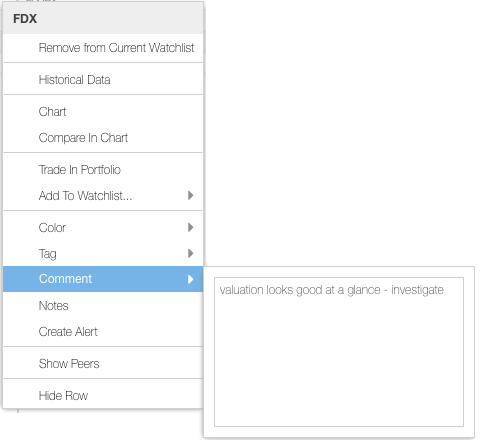
Comments are quick notes about a ticker. For example, you might jot something like…
Enter a comment through a ticker’s dropdown menu
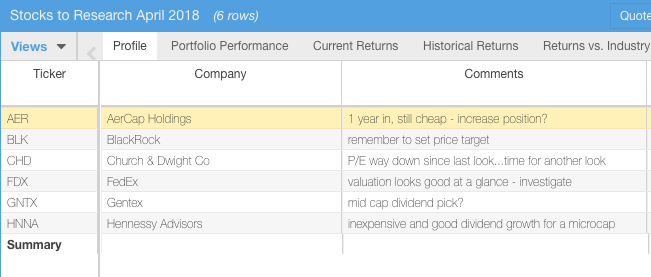
You can add your comments as a column in the Table (Actions > Add Column), so you can view and edit them directly in the Table spreadsheet, like so:
Comments viewed as a Table column
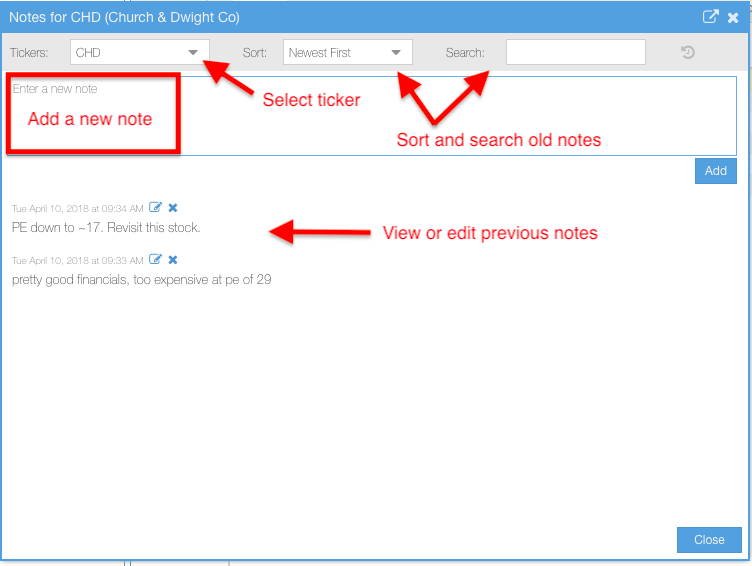
Notes are similar to comments, but one level up in terms of functionality. They open in a separate window—providing more space for your writing and links—and they are time-stamped, so you can build a log of your observations. You can also search, edit, and delete old notes.
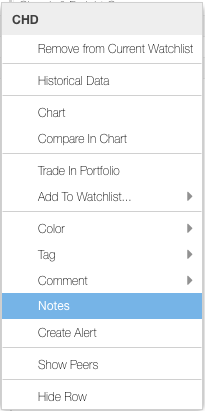
Notes are very easy and intuitive to use. To start, select ‘Notes’ from a ticker’s dropdown menu.
Access Notes through a ticker’s dropdown menu
The Notes window that opens will automatically be associated with that particular ticker, but you can also access other tickers’ notes from that same window. If you accumulate a lot of notes for a single ticker, you can use the searchbox to find particular content.
The Notes window
Both Notes and Comments are a snap to use and a great way to keep all your research and ideas centralized in one application. Try them out today!
Custom Metrics (Premium)
Have you ever wanted to create your own equations or datapoints in Stock Rover using metrics that we already offer?
Now with our Custom Metrics facility, you can do just that.
The feature works similarly to the equation screener [5], and the possibilities are literally endless. But don’t let that intimidate you! Creating a new metric could be as simple as creating a ratio from two metrics you often compare, or averaging (or weight-averaging) metrics you often use together to get a picture of growth, efficiency, valuation, et cetera. It’s like creating an equation in an Excel spreadsheet cell, but the metric can then be viewed for any stock in the Table or used in a screener.
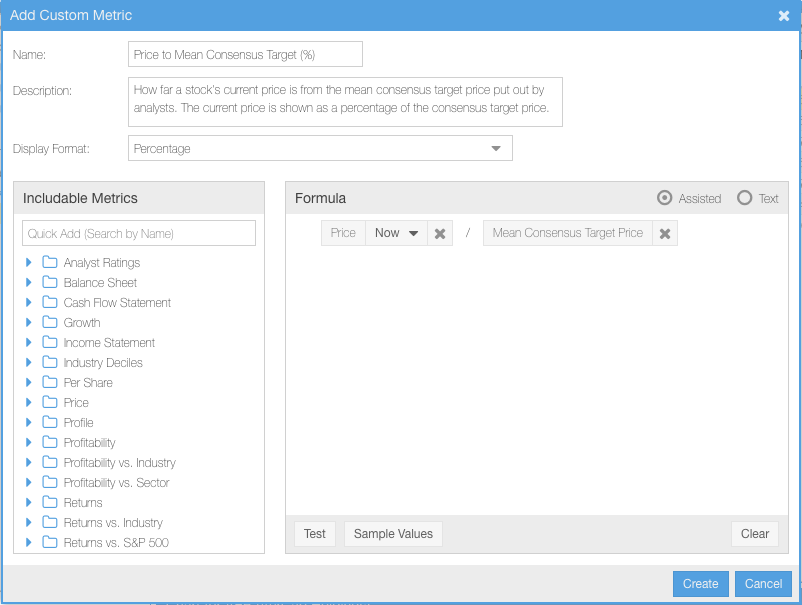
To show you how it works, we’re going to make a simple custom metric that compares a stock’s current price to the mean consensus target price put out by analysts. We’ll call it Price to Mean Consensus Target (%). It’s a long name for a metric but it does have the virtues of being descriptive and accurate.
Price to Mean Consensus Target would allow you to see (in one glance, with no additional calculation) how far off a stock’s current price is from the analysts’ target price, which could be useful in deciding whether it’s time to buy or sell a particular equity.
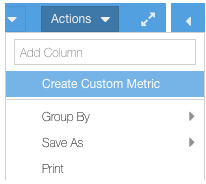
To start, head to the Table (lefthand navigational menu > Table), then select “Create Custom Metric” from the Actions dropdown, shown here:
Select ‘Create Custom Metric’ from the Actions menu in the Table
In the window that opens, you can begin designing your new metric. Start by giving it a name and a brief description, and format of the data (for our metric, we are using a percentage with two decimal places).
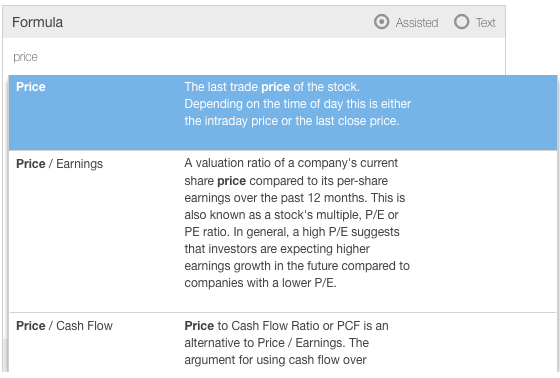
Then enter the formula for your custom metric into the formula box. You can add metrics using the ‘Quick Add’ menu on the left (search or browse to the metric you want), or simply by typing the metric’s name into the formula box, and selecting from the menu that appears, as shown here:
Simply start typing in the Formula box to find a metric you want to use
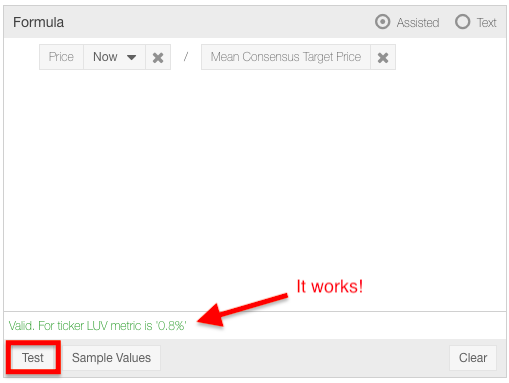
Create equations with the same formatting that you would in a spreadsheet cell, using symbols like * / + – = with parentheses as needed. Once you have your equation entered, make sure it works using the ‘Test’ button at the bottom of the form. You can get more detail and swap out your test ticker through the ‘Sample Values’ button.
Make sure your formula works using the ‘Test’ button
Now click ‘Create’ and voila! You can use this metric like any other in Stock Rover. For example, here is our new metric shown in the Table:
Your custom metric can be added to any Table view, or used in a screener
Pretty cool, right? And as mentioned before, you can use these metrics in a screener too. Here are some ideas for custom metrics that you could create on your own:
- Total Debt / Sales
- 5 Year Average Dividend Paid
- A weighted average of your favorite growth metrics
- A weighted average of your favorite valuation metrics
- A weighted average of your favorite financial safety metrics
We hope you find notes, comments, and custom metrics to be as fun and useful as we do. We’d love to hear how you use these features to make your stock research more productive—let us know in the comments!
