Contents
- Overview [1]
- Filter Toolbar [2]
- Keyboard Shortcuts [3]
- New Metrics [4]
- Summary [5]
Overview
We are continually improving and refining Stock Rover, based on your feedback and our own vision for the product. As we develop new capabilities, we add them into the product automatically on a regular basis. In this blog post I want to do a roll up of the new things we have added to the product in the last couple of months.
Filter Toolbar
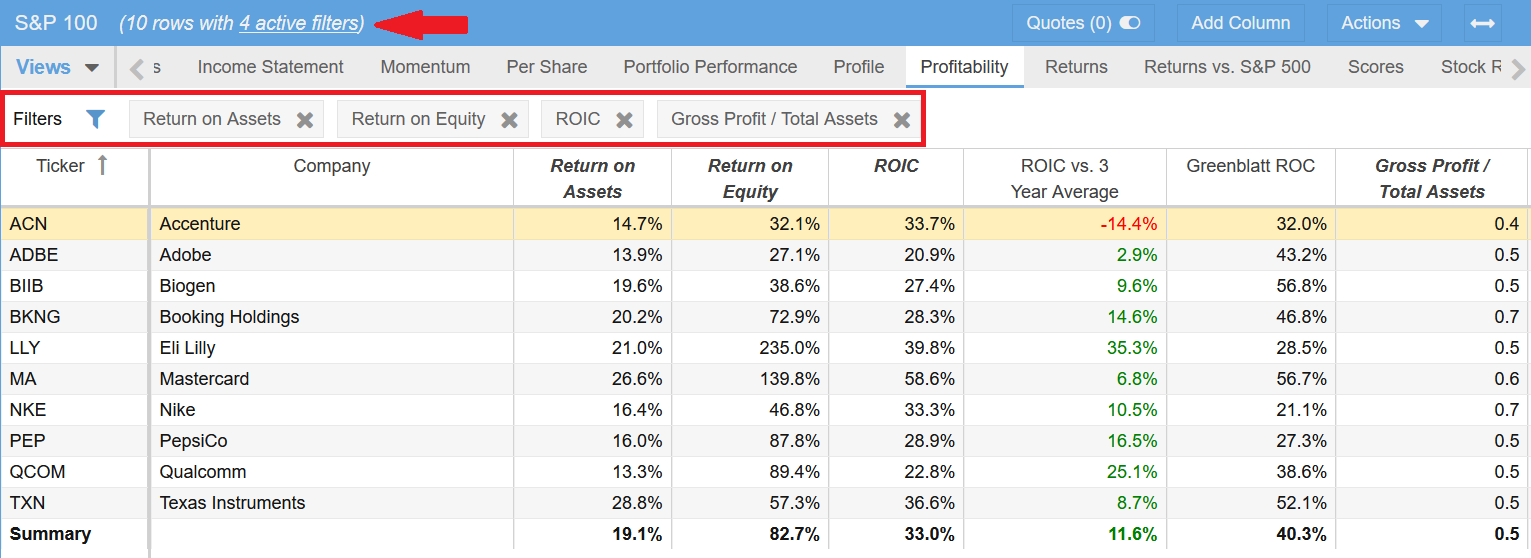
We have added a much more intuitive way to show when columns in the Table have filters applied. One of the most common questions we get in support is “Why are not all my stocks showing in the Table?”. The reason is usually because filtering has been applied to one or more of the columns and the user is unaware of the filters. So we re-engineered the product to be more helpful and make it more obvious when filters are applied. The result is a new Filter Toolbar which makes it much easier to see and remove filters for the Table. The screenshot below shows an example of this. Note when a column is filtered, the column label is also bolded and italicized.
Clicking on the “x” next to the filter or on the blue funnel to the left will allow you to easily remove one or more Table filters. When all filters are removed on a table, the Filter Bar disappears.
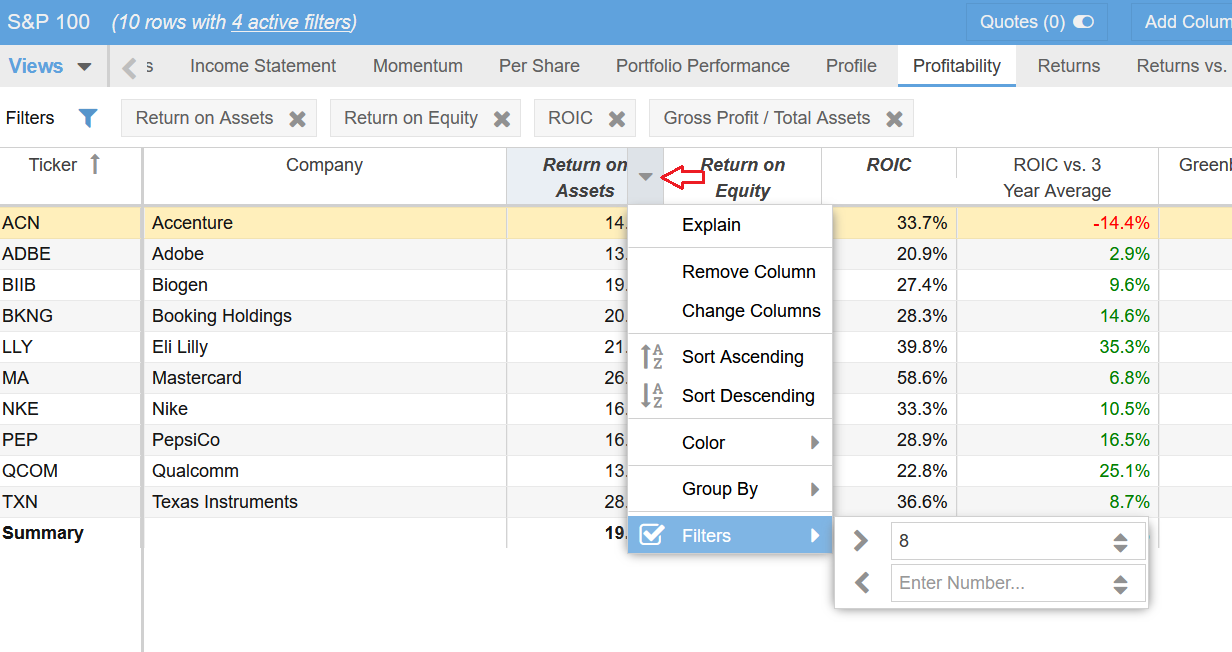
Note you add a filter by hovering over a column header with your mouse, clicking on the down-arrow that appears and selecting Filters from the ensuing menu as shown below.
Keyboard Shortcuts
Stock Rover has a set of useful keyboard shortcuts to make it fast and easy to do common tasks within the Stock Rover application.
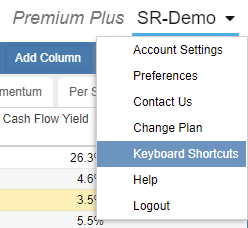
The keyboard shortcuts can be viewed from the account pull down menu as seen in the screenshot below.
The keyboard shortcuts are as follows:
| Alt-G | Expand/Collapse Grey Selector Menu |
| Alt-N | Expand/Collapse Navigation Panel |
| Alt-T | Switch to Table |
| Alt-C | Switch to Chart |
| Alt-I | Switch to Insight |
| Alt-A | Switch to All |
| Alt-R | Resize Columns to Fit |
| Alt-D | Detach the Window |
| Alt-S | Export the Table |
| Alt-H | Display Help |
New Metrics
The metric count in Stock Rover continually grows as we create new data points that can be valuable to you in your investment research activities. Recently, we have added the following metrics in Stock Rover. You can add any of these metrics to your Views and you can use them in your Screeners. Please note, all of the metrics listed below except EBIT and Forward EBIT require the Premium Plus subscription level.
| Metric | Description |
|---|---|
| EBIT | Earnings before interest and taxes is essentially net income with these things added back to it. It is used to analyze and compare profitability without the effects of capital structure and tax expenses. |
| Forward EBIT | The mean analyst-estimated Forward EBIT for the next fiscal year. |
| Best Monthly Return | The best monthly return in the past 60 months. This metric is updated live when markets are open. |
| Worst Monthly Return | The worst monthly return in the past 60 months. This metric is updated live when markets are open. |
| Max Drawdown 1‑Year | This risk measure shows the largest peak to trough price drop in the past year. Our calculations use intraday high and low values and adjust for dividend payments. |
| Max Drawdown 1‑Year Peak | The date of the peak price before the largest drawdown in the past year. |
| Max Drawdown 1‑Year Trough | The date of the trough price after the largest drawdown in the past year. |
| Max Drawdown 2‑Year | This risk measure shows the largest peak to trough price drop in the past 2 years. Our calculations use intraday high and low values and adjust for dividend payments. |
| Max Drawdown 2‑Year Peak | The date of the peak price before the largest drawdown in the past 2 years. |
| Max Drawdown 2‑Year Trough | The date of the trough price after the largest drawdown in the past 2 years. |
| Max Drawdown 3‑Year | This risk measure shows the largest peak to trough price drop in the past 3 years. Our calculations use intraday high and low values and adjust for dividend payments. |
| Max Drawdown 3‑Year Peak | The date of the peak price before the largest drawdown in the past 3 years. |
| Max Drawdown 3‑Year Trough | The date of the trough price after the largest drawdown in the past 3 years. |
| Max Drawdown 5‑Year | This risk measure shows the largest peak to trough price drop in the past 5 years. Our calculations use intraday high and low values and adjust for dividend payments. |
| Max Drawdown 5‑Year Peak | The date of the peak price before the largest drawdown in the past 5 years. |
| Max Drawdown 5‑Year Trough | The date of the trough price after the largest drawdown in the past 5 years. | Max Drawdown 10‑Year | This risk measure shows the largest peak to trough price drop in the past 10 years. Our calculations use intraday high and low values and adjust for dividend payments. |
| Max Drawdown 10‑Year Peak | The date of the peak price before the largest drawdown in the past 10 years. |
| Max Drawdown 10‑Year Trough | The date of the trough price after the largest drawdown in the past 10 years. |
Summary
So that will cover this round of improvements to Stock Rover. Nothing huge, but a lot of little improvements that we hope you find useful in helping you become more productive with Stock Rover. For those that want something huge, check out our blog post on Stock Rover Research Reports [9].
We are working hard to continually improve Stock Rover to make it the best possible product for your investment needs. We make changes incrementally to the product, rather than in one giant release so we can get the changes to you faster. Periodically we will blog about the changes we have made since the last blog so you can be aware of what is new and available to you in the product. Stay tuned to this channel for future updates!


Comments Disabled To "New Additions to Stock Rover"
#1 Comment By Jay Follansbee On January 11, 2020 @ 10:10 am
Two almost proprietary indicators/ratios developed by tastytrade/tastyworks are their option Liquidity indicator and IVR (implied volatility ratio)-both cornerstones to research driven options trading. Interactive Brokers added IVR and related ratios over the last year, but still does not provide an option liquidity measure. Probably not complicated for you guys to provide (easy for me to say?), but would cater to another entire class of investors, possibly.
#2 Comment By Howard Reisman On January 11, 2020 @ 11:12 am
Thank you for the feedback on those two indicators. We will add them to the list of metrics that we are considering for the future.