This is the third blog post in our series that recreates the research from our popular June 11th Introduction to Investment Research webinar [1]. In our first post [2], we showed you how to get a feel for the market, and in our second post [3], we showed how to use Stock Rover’s Dividend Growers ranked screener to find the top-rated dividend stocks according to our criteria. The top-rated stock happened to be in Basic Materials, a sector we decided to avoid, so we turned our attention to the second stock: Nu Skin Enterprises (NUS). After looking at its quant score and its performance over the past 2 years, we decided that this stock is worth investigating.
But if you’ve just found a stock you’ve never heard of, where do you even begin to start research?
Contents
- Chart It [4]
- Learn about the Company [5]
- Dig a Little Deeper [6]
- Analyst Estimates [7]
- Growth [8]
- Income Summary [9]
- Balance Sheet [10]
- Cash Flow [11]
- Profitability [12]
- Read Relevant News [13]
Chart It
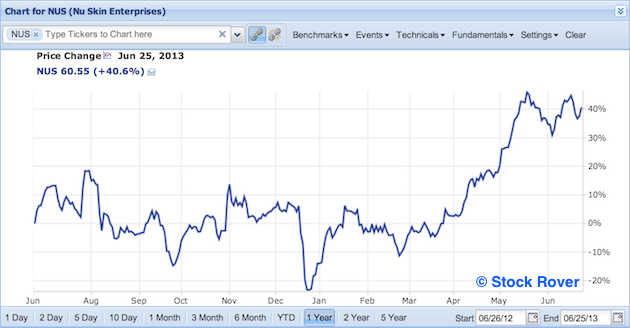
Before we do anything we’re going to chart NUS to see how it’s done in the past. Let’s start with a 1-year time period.
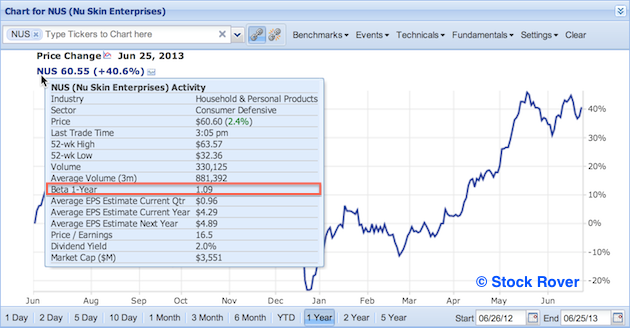
It looks strong in the past few months, but a little wild. If you have ticker info tooltips [15] enabled, you can mouseover the ticker in the legend to get its beta (as well as some other key metrics).
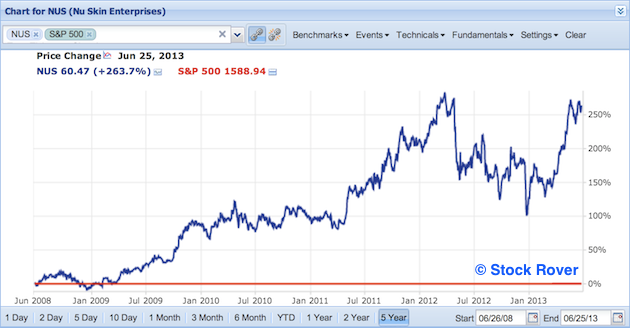
Its beta is 1.09, which means that it varies more than the S&P 500 (this is actually down from 1.24, where it was a couple of weeks ago). This isn’t necessarily a bad thing, but it is worth noting. If we go back two years, we’d see again that it’s volatile. Now let’s look at five years, and let’s adjust the price for dividends [17] in order to get a more complete picture of how the stock has done. I’ll also add in the S&P as a benchmark [18] and then set it as a baseline [19] so we can easily see NUS’s relative performance.
If we look up at the legend, we can see that with dividends added to the price, NUS outperformed the S&P by over 300% in the last five years, which is very encouraging. If we clicked the chart’s preset time periods, we’d see that NUS outperformed the S&P in every period down to the last three months.
So this looks like a strong stock. We’re still a little concerned about that high volatility, but its stock performance is compelling enough to warrant more research.
Learn about the Company
So what do you do when you’ve found an interesting stock, but know nothing about the actual company? The Summary tab in the Insight panel is a very good place to start.
First, read the company description (provided by Morningstar.) When we do that, we see that NUS is a global company in personal care with a direct-selling model, and its competitors are Avon, MaryKay, and Herbalife, so we know the space that this company is operating in. What does Morningstar think of it?
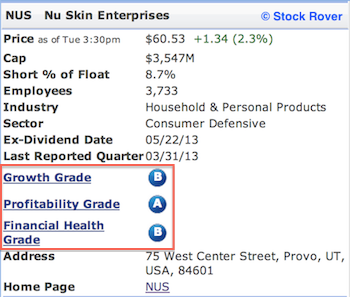
The Growth, Profitability, and Financial Health grades given in the Summary tab are Morningstar’s grades for the selected company. These are pretty toughly graded, so a B in growth, an A in Profitability, and a B in Financial Health are pretty good.
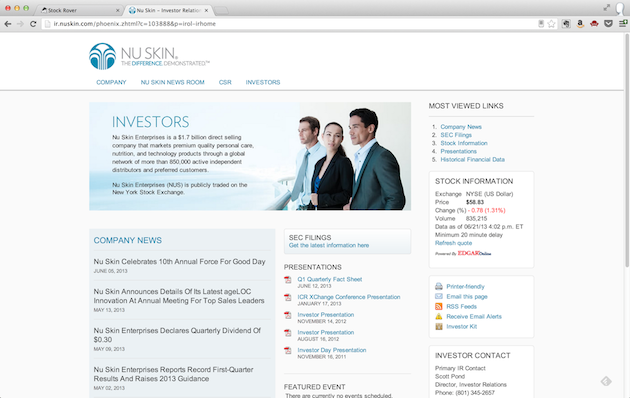
Next, let’s check out the website. In the summary tab the ticker symbol is hyperlinked to the company’s home page (you can see this in the above image), so if we click on it, it will open in a new tab in our browser. If you do this, you’ll immediately see that it’s a nice website with different sections depending on which country you’re located in. At the bottom is a link for “investors,” so let’s click on that.
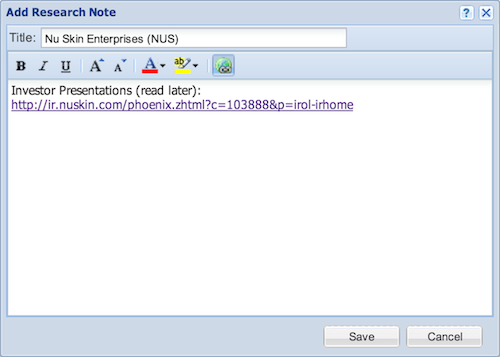
That will bring us to a page that has documents that we’re definitely going to want to go through later—filings, stock info, investor presentations…let’s create a new note in our database for NUS where we can keep track of tasks like this for later.
(Make sure to use the hyperlink icon in the note toolbar in order to have the text link to the page.)
Next, let’s head back to the summary tab and take a quick look at key performance, valuation, profitability, and growth metrics for NUS compared against those for its industry (Household and Personal Products) and the S&P 500.
Below I’ll quickly run through some preliminary thoughts that arise while looking at NUS’s summary statistics.
Performance
Focusing on the 1-month and 1-year return, we can see that NUS has outperformed the S&P and its industry—this is good.
Valuation
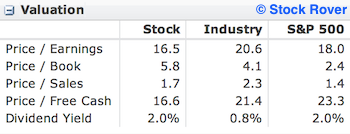
Its P/E is lower than the industry average and below the S&P, which means the stock is comparatively cheaper. Its Price/Book is higher, Price to Sales is lower than the industry and in line with the S&P 500, and the dividend yield is above the industry average and level with the S&P. So it doesn’t look like this stock is overvalued, despite the fact that it all signs are pointing toward growth.
Profitability
Here we can immediately see that its gross margin is huge, while its operating margin is more normal. I’m going to add to my NUS note to look into this later.
Growth
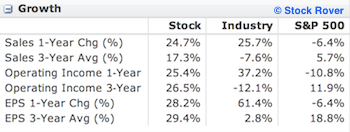
This is where NUS really shines. Its sales growth is quite strong, with its one-year change larger than its 3-year average, meaning that the sales growth is accelerating. The growth in operating income is huge, as is the growth in EPS. This section shows that NUS is a very fast-growing company, particularly for a company in the Staples sector.
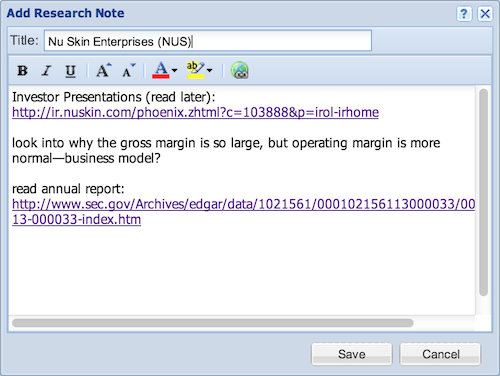
Next, we’ll want to read some of the SEC filings, so let’s continue down the summary tab and click on “Annual Reports” under the “Filings” section. This will bring up a window where we can select to view any of the the company’s 10-Ks. When clicked, we’re taken straight to EDGAR’s page for that 10-K (in a new tab). One more click and we’re reading the annual report. If you’re seriously considering investing in a company, it’s important to go through these reports, but for now we’ll bookmark the report to read later. So, we’ll grab the URL and put it into our NUS note, which now looks like this:
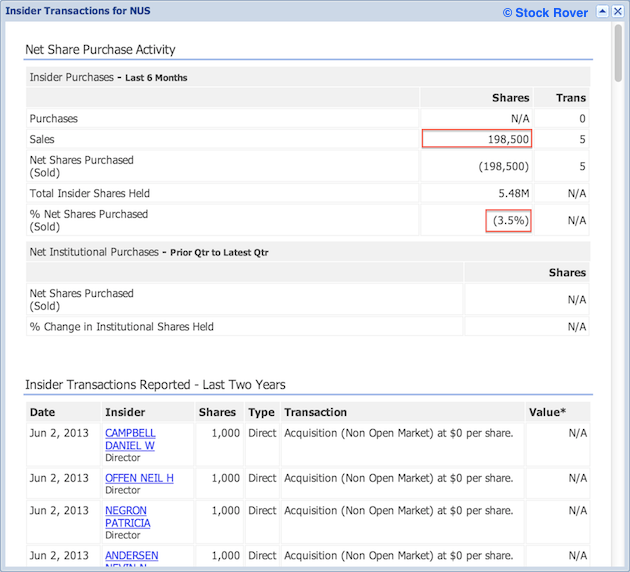
Next, we’ll look at Insider Transactions to see if there’s anything unusual going on. So, we’ll click that link, which brings up the following window:
There haven’t been any insider purchases in the last six months, but 198,500 insider shares have been sold. If too many officers are selling, it could signal some forthcoming bad news about the company, but in the case of NUS the insider sales are only 3.5% of all the insider shares, which isn’t quite enough to be worrisome.
If we scroll down, we’ll see the details on insider transactions from the last two years. While many officers haven’t sold anything, a few officers, such as Schwerdt and Truman, have sold off a fair amount. This is another thing I’d like to investigate—it’s possible that this is normal for NUS, but because I’m new to this stock, I’d like to make sure that this isn’t cause for concern. I’ll add this to my To Do list in my NUS research note. Next, we’ll go to detail tab to go into further depth.
Dig a Little Deeper
Analyst Estimates
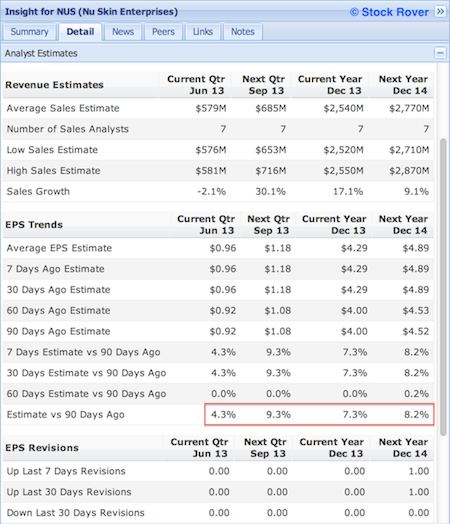
The first section we’ll look at is Analyst estimates, which is quite important as it lets you know how analysts feel about the future of the company. I like to focus on companies whose numbers were revised upward, and avoid companies whose numbers were revised downwards. Generally, a revision in one direction is a harbinger of more to come, so if an analyst has revised upwards, it’s likely they will revise their estimate upward again later.
If we focus our attention on the boxed section of the above screenshot, we see that everything is a positive number, meaning analysts are revising their estimates for EPS upwards. The fact that analysts are more bullish on NUS than they were 90 days ago paints a rosy picture for NUS.
Growth
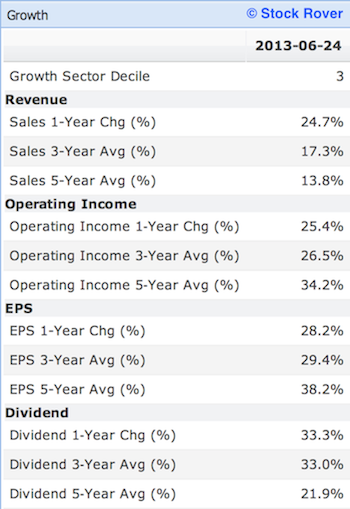
Next we’ll look at the Growth section. We’ve already touched on the growth story a little, as NUS passed the quant with flying colors, and we already saw that their summary growth statistics were strong, but it’s always good to take a closer look.
Again, these numbers look really good. The sales growth is accelerating, and operating income, EPS, and dividends are all growing rapidly (if not accelerating.)
Income Summary
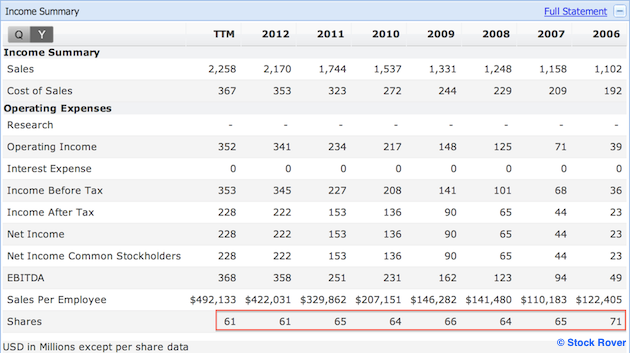
Next let’s look at the Income Summary, and in this section we’ll focus on the share counts—we want to make sure that the stock isn’t getting diluted.
Share counts have decreased in past six years, and if we switched it to quarterly, we’d see the same thing, so it looks like they are buying back stock, which is a good sign.
Balance Sheet
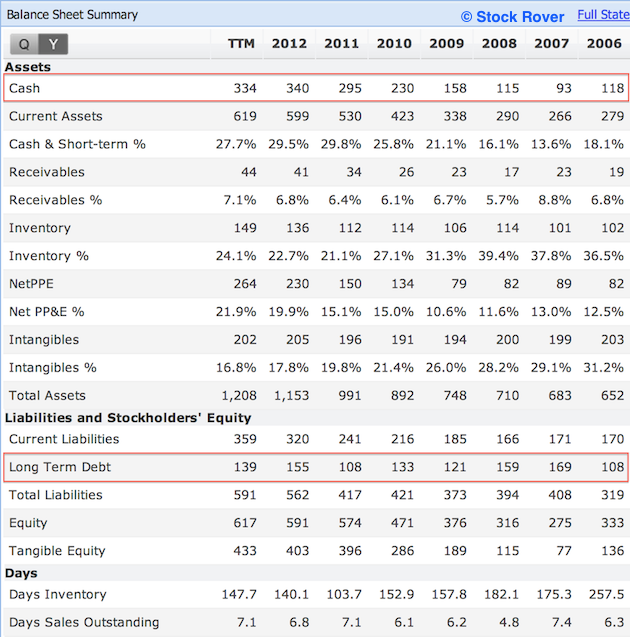
Next, we’ll peak at the balance sheet, and the main component we’ll look at is the debt.
The debt is hovering around $100 million, but the cash considerably exceeds debt (and is increasing) so it’s not too worrisome. Debt/Equity tells a similar story, it’s around 0.3 so it NUS has some debt, but overall it’s not too bad.
Cash Flow
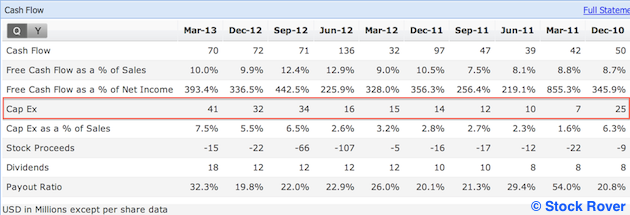
We won’t spend too much time in cash flow, but we just want to see if anything immediately jumps out.
The first thing we notice is that Cap Ex is coming up. Hopefully this means that NUS is investing intelligently in the business, which, given the growth story, seems likely. Other than that, everything in the cash flow statement looks pretty normal so we’ll move on.
Profitability
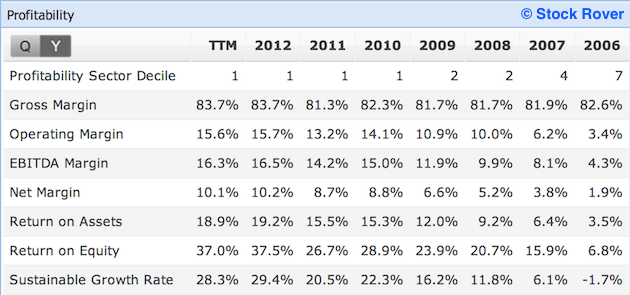
Next let’s look at yearly profitability, and there’s really nothing to like here.
Here we see that the operating margins and net margins are coming up over time, as are the return on assets and return on equity, all of which points towards increasing efficiency, which is good news for shareholders. In case we needed more convincing, the profitability sector decile has gone from 7 to 1 over the past six years.
After going through the detail tab, NUS is looking really good. The only negative so far is the volatility, but if a stock is showing really strong growth, I’m willing to ride out the bumps.
Read Relevant News
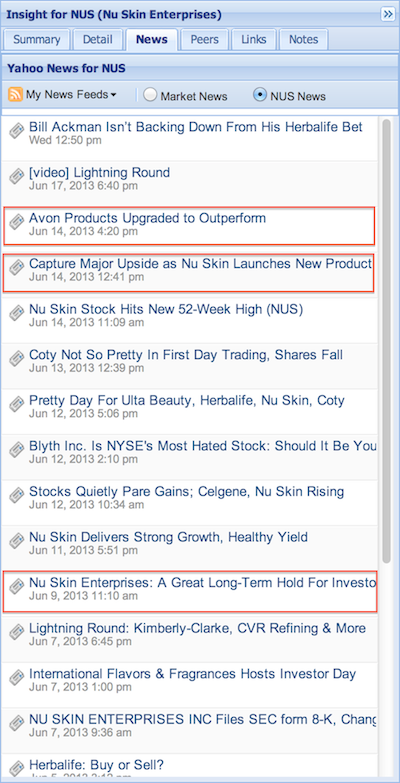
Next we’ll take a look at the News tab to see if there’s been anything, good or bad, published about NUS recently, or about its competitors. In Stock Rover’s news tab, you can elect to show ticker-specific stories if your news source is either Yahoo or Google. Just quickly glancing at the news stories, I see a few that I’d like to read.
I’ll open these new stories, and then save them to my NUS note so I can read them later.
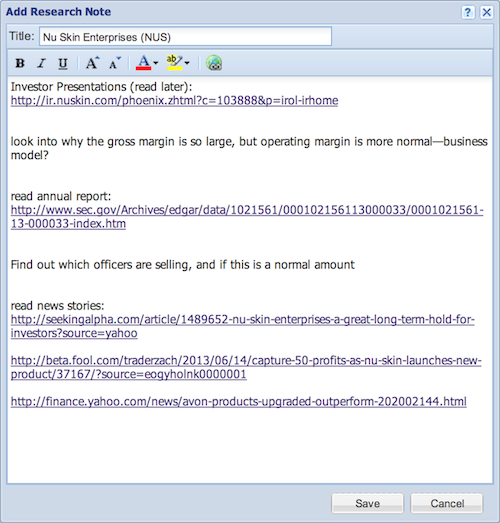
At this point, we have a pretty good feel for NUS. We know that while it’s volatile, it’s showing strong signs of growth. Additionally, we have a research note on NUS with further tasks to be completed before actually committing to invest, such as reading investor presentations and the most recent 10-K. At this point, our NUS note looks like this:
Now that we’ve gotten a good handle on NUS, it’s time to see how it compares against its peers. In the next installment, we’ll take a look at how NUS is doing against other stocks in its industry.
Link to part 1 – Getting a Feel for the Market [2]
Link to part 2 – Finding a Stock to Research [3]
